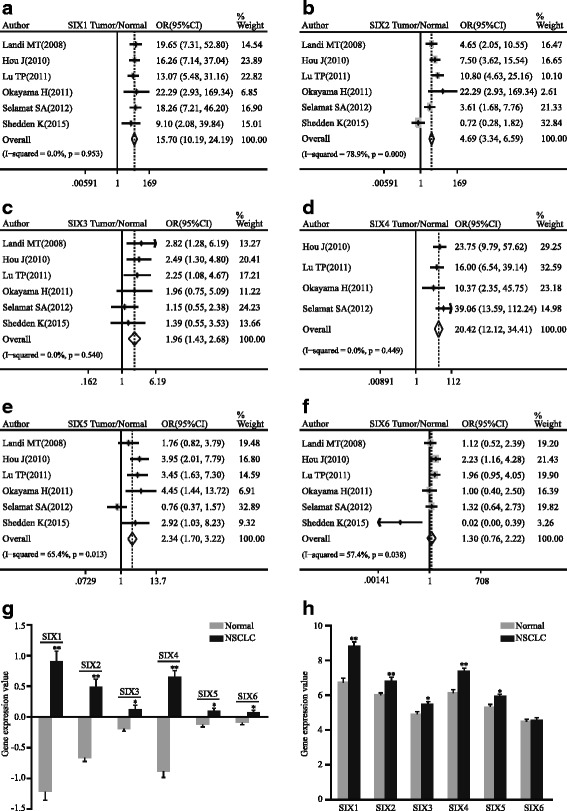
Fig. 2.

Forest plot of odds ratio (OR). CI confidence interval. Relative mRNA level of SIX1 (a), SIX2 (b), SIX3 (c), SIX4 (d), SIX5 (e), and SIX6 (f) in NSCLC compared with normal lung tissues. Bar graph representation of relative SIX family mRNA level of NSCLC compared with normal lung tissues in GSE19188 (g) and GSE19804 (h). *p < 0.05, **p < 0.0001
