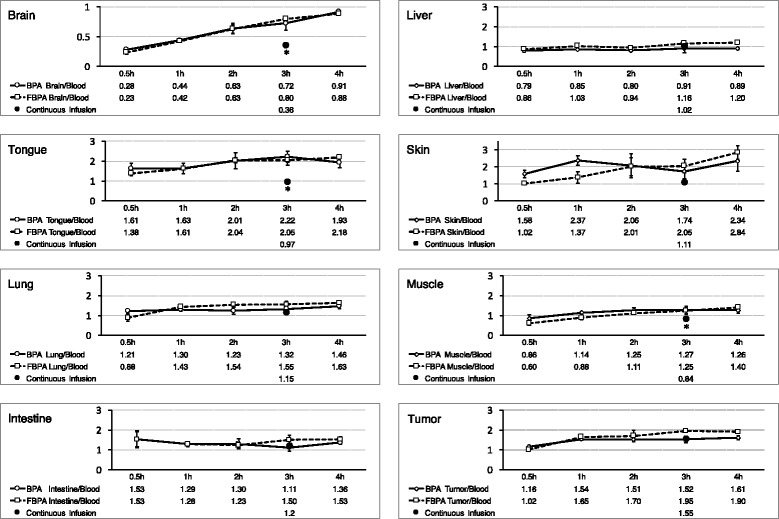
Fig. 3.

Transition of the tissues to blood ratio of boron concentrations. This figure shows the time transition of each normal tissue to blood ratio and tumour tissue to blood ratio of boron concentrations. The brain to blood ratio increased over time because the boron compounds in the brain were retained 4 h after the injection of L-BPA or [19F]-L-FBPA, while the boron in the blood was excreted over time. There was no difference in the transition of the normal tissue to blood ratio and tumour tissue to blood ratio between the L-BPA group and [19F]-L-FBPA group. In this figure, the difference between the administration protocols is indicated. The mean boron concentration of the L-BPA group and [19F]-L-FBPA group by continuous infusion is denoted as black circles at the time point of 3 h after the start of infusion in this figure. Each continuous infusion value was substituted by the mean value of L-BPA and L-FBPA in continuous infusion protocol. Star signs (*) means significant difference between administration protocols (p < 0.05)
