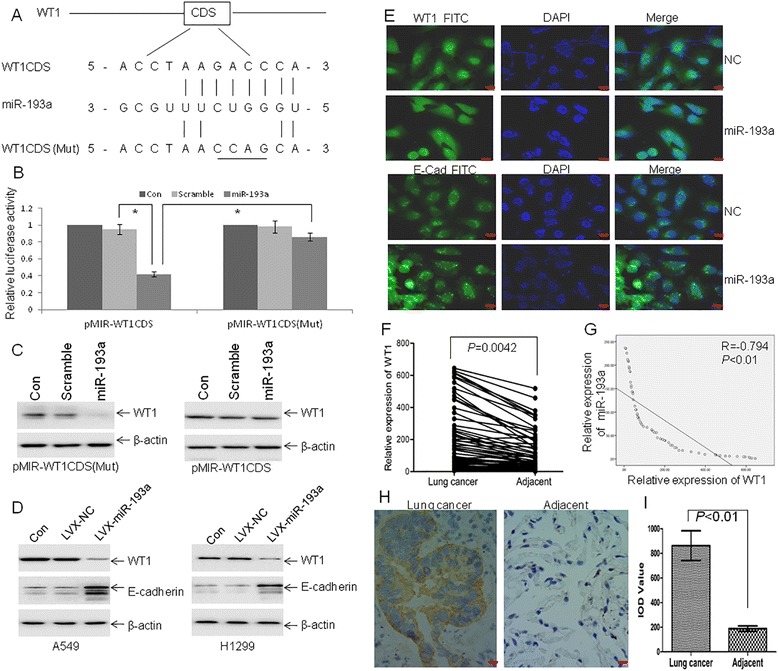
Fig. 3.

miR-193a modulates E-cadherin expression through targeting WT1. a Schematic of putative binding sites for miR-193a in WT1 CDS. b A549 cells were transfected with wide-type pMIR-WT1CDS, pMIR-WT1CDS (Mut), pMIR-NC, and the pRL-SV40 containing Renilla luciferase gene for 24 h, followed by the transfection with miR-193a mimic or Scramble for another 24 h. Firefly and Renilla luciferase activities were both detected and histograms showed the Firefly luciferase activities normalized to Renilla luciferase activities. *P < 0.01 versus Scramble. c Western blot for WT1 was performed in lysates from A549 cells, which were treated as Fig. 3b. d WT1 and E-cadherin expressions were performed in A549 and H1299 cells transfected with lentivirus LVX-miR-193a or LVX-NC. e Immunofluorescence (IF) staining assay for WT1 and E-cadherin was analyzed in A549 cells transfected with LVX-miR-193a or LVX-NC. Scale bar = 50 μm. f WT1 expression was measured in lung cancer tissues and adjacent non-tumor tissues by qRT-PCR. n = 62. g The plotting of miR-193a versus WT1 expression showed an inverse correlation between them. A statistically significant correlation between miR-193a versus WT1 expression was observed by Pearson’s method. n = 62. h A representative picture of immunohistochemical staining of WT1 in an adenocarcinoma (left) and adjacent non-cancer specimen (right). i Average value of integrated optical density (IOD) was evaluated by analyzing six fields per slide and recorded in the histogram. n = 20
