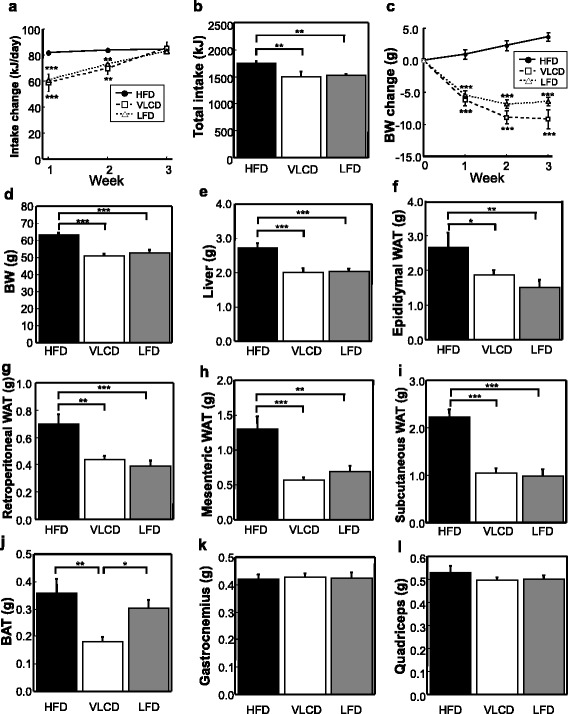
Fig. 1.

Daily and total energy intake, BW change, and body and tissue weights. (a) Daily energy intake. Food intake was measured daily during the study and weekly averages were calculated. (b) Total energy intake. (c) BW change over 3 weeks. The weights of the body (d), liver (e), epididymal (f), retroperitoneal (g), mesenteric (h), and subcutaneous WAT (i), BAT (j), gastrocnemius (k), and quadriceps (l). HFD, high-fat diet; VLCD, very-low carbohydrate diet; LFD, low-fat diet. Values are the mean ± SEM (n = 8). *P < 0.05, **P < 0.01, ***P < 0.001
