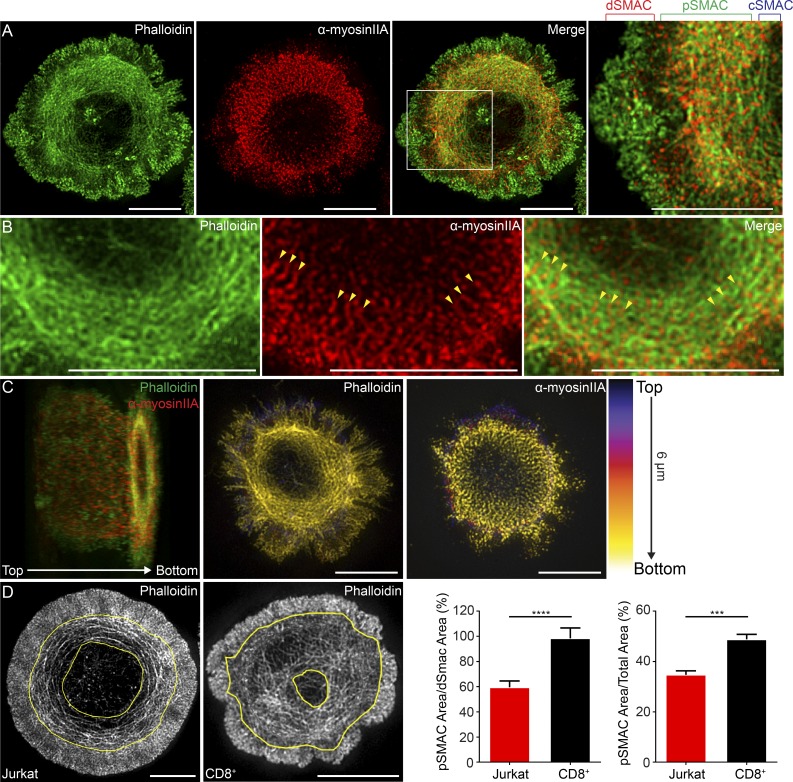
Figure 2.
Actomyosin arcs are also a very prominent feature of the primary mouse CD8+ T cell IS. (A) 3D-SIM image of a primary mouse CD8+ T cell stained with phalloidin (green) and anti–myosin IIA antibody (red). (B) Magnified views of actomyosin arcs in a separate CD8+ T cell stained as in A. Yellow arrowheads mark sarcomere-like pattern of myosin IIA. (C, left) Cell in B color-coded by z position; each channel is separated in middle and right panels. Lighter colors are closer to the coverslip. (D) Area occupied by pSMAC actin arcs (bracketed by yellow traces) in typical Jurkat IS (first panel) and primary mouse CD8+ T cell IS (second panel). The ratio of pSMAC to dSMAC area (third panel) and pSMAC to total IS area (fourth panel) for Jurkat and mouse CD8+ T cells. n = 17–24 cells/condition. Data are means ± SEM. SMAC zones bracketed in A at top. Bars, 5 µm. ***, P < 0.001; ****, P < 0.0001.

