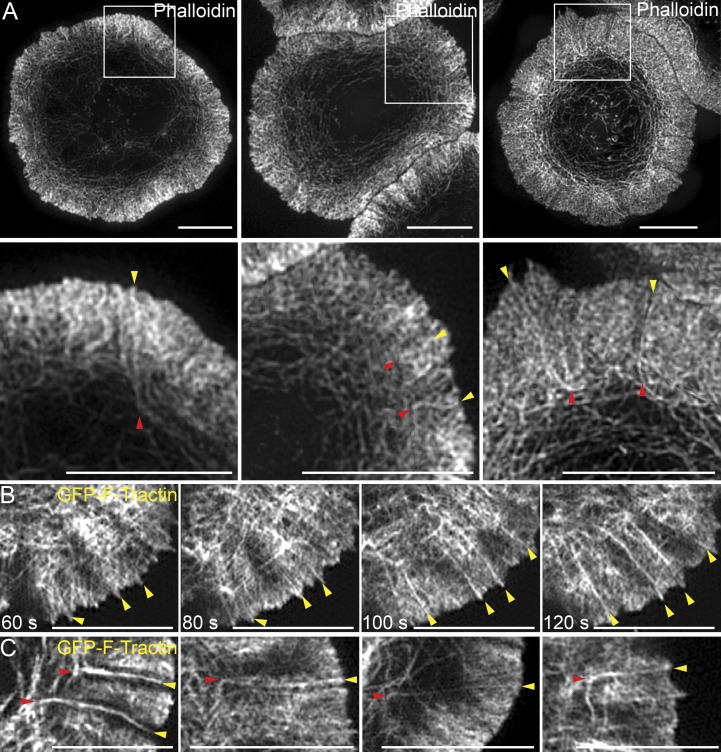
Figure 3.
SIM imaging reveals linear actin filaments/bundles embedded in the branched actin network of dSMAC. (A) 3D-SIM images of three representative phalloidin-stained Jurkat T cells. (B) Successive still images from a TIRF-SIM video of a Jurkat expressing GFP–F-Tractin (Video 3). (C) Four still images from TIRF-SIM videos of Jurkats expressing GFP–F-Tractin. Yellow arrowheads mark the origin of linear actin filaments/bundles embedded in the branched actin network of the dSMAC, whereas red arrowheads mark where they bend upon exit from the dSMAC. See also Video 4. Bars, 5 µm.

