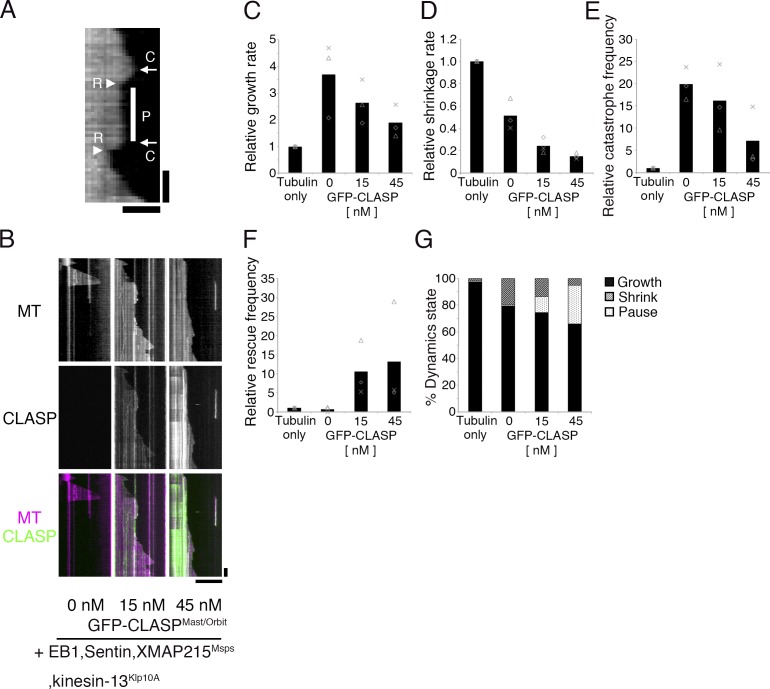
Figure 2.
Reconstitution of dynamic MTs with five factors. (A) An example of pause (P) identified in the kymograph. Catastrophe (C) and rescue (R) events are also marked. Bars: (horizontal) 2 µm; (vertical) 30 s. (B–G) Kymographs and kinetic parameters of MT polymerization dynamics with 0–45 nM GFP-CLASPMast/Orbit in the presence of 15 µM S2 tubulin, XMAP215Msps, EB1, Sentin, and kinesin-13Klp10A. The mean values of each experiment are marked in gray, whereas the mean values of all the experiments are indicated by black columns (three independent experiments). Relative values are plotted in the graphs, whereas the actual values are presented in Table 1. Bars: (horizontal) 10 µm; (vertical) 1 min.

