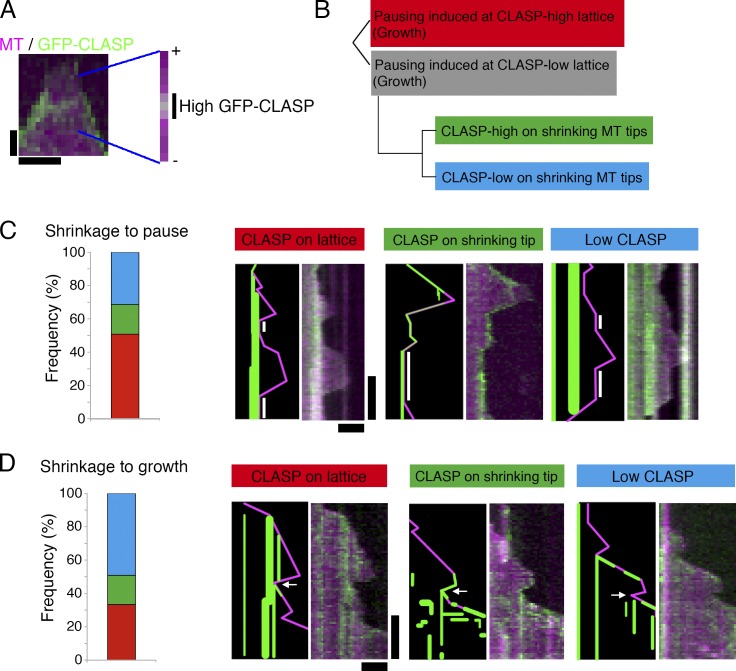
Figure 4.
Pausing was induced at the CLASPMast/Orbit accumulation site with a high probability. (A) GFP-CLASPMast/Orbit distribution along the MT. An MT that just started to shrink is highlighted. Marked are the regions at which GFP-CLASPMast/Orbit was accumulated. Bars: (horizontal) 30 s; (vertical) 1 µm. (B–D) Classification of shrinkage-to-pause (C; n = 51) or shrinkage-to-growth (D; n = 63) events based on GFP-CLASPMast/Orbit accumulation at the turning point. Kymographs and the schematic drawings are displayed. Actual data are derived from the experiments performed in Fig. 2 (shrinkage to growth) or Fig. 5 (shrinkage to pause). Pausing phases are marked with white bars, whereas arrows indicate the rescue points for regrowth. Bars: (horizontal) 2 µm; (vertical) 1 min.

