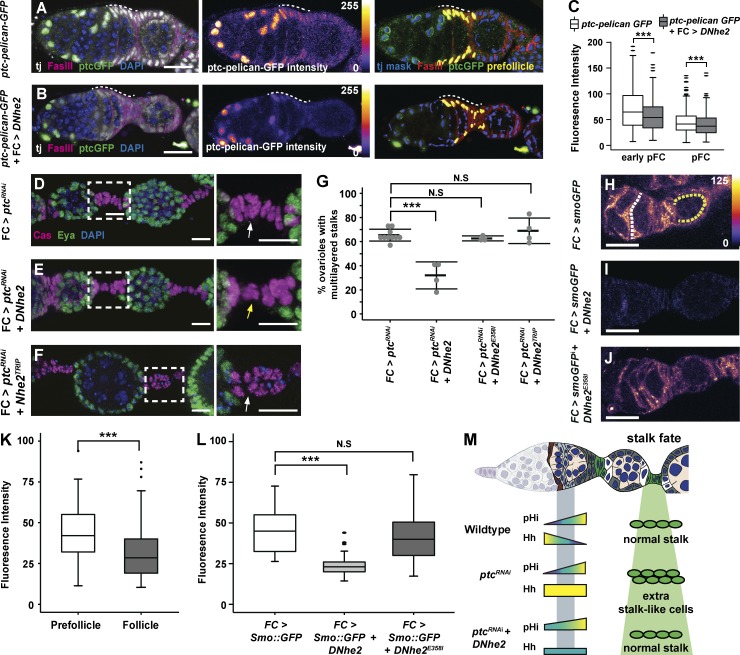
Figure 4.
DNhe2 overexpression attenuates Hh signaling. (A and B) Compared with control (A), overexpression of DNhe2 decreases Ptc-pelican-GFP expression. Pseudocolor of GFP channel in A and B reflects fluorescence intensity. Nuclear volumes selected for intensity measurements (yellow) are shown (right). pFC regions are indicated with white dashed lines. (C) Quantification of Ptc-pelican-GFP fluorescence intensities in control germaria (white boxes) with DNhe2 overexpression (gray boxes) in early pFCs or pFCs. n > 450 cells for all genotypes; n = 3 independent replicates. (D–F) Multilayered stalk phenotype in FC > ptcRNAi (D) is less penetrant in FC > ptcRNAi + DNhe2 (E), but not in FC > ptcRNAi + DNhe2TRiP RNAi (F). Insets enlarged in D–F (right). White and yellow arrows indicate stalks with double or single rows of cells, respectively. (G) The frequency of ovarioles with multilayered stalks in each genotype. n > 100 ovarioles for all genotypes; n = 3–6 independent replicates. (H–J) In ovarioles expressing Smo::GFP only (H), the fluorescence intensity is higher in pFCs (yellow dotted line) than in FCs (white dotted line). Coexpression of wild-type DNhe2 (I) but not DNhe2E358I (J) significantly reduces GFP fluorescence throughout the germarium. (K) Quantifications of the fluorescence intensity in germaria with FC-Gal4 driving Smo::GFP expression. n = 31 germaria. (L) Expression of DNhe2 but not DNhe2E358I decreases the fluorescence intensity of Smo::GFP. n > 29 germaria for all genotypes. (M) Summary of the genetic interaction between RNAi knockdown of ptc and overexpression of DNhe2. In wild-type germaria, pHi increases in pFCs as Hh pathway activity decreases, and a normal stalk forms. RNAi knockdown of ptc results in excessive Hh signaling and multilayered stalks. Overexpression of DNhe2 increases pHi, attenuates Hh signaling, and suppresses the stalk cell phenotype caused by RNAi knockdown of ptc. Bars: (A, B, and H–J) 10 µM; (D–F) 20 µm. ***, P < 0.001. P-values were determined with a t test in C, K, and l and a χ2 test in G.

