Figure 5.
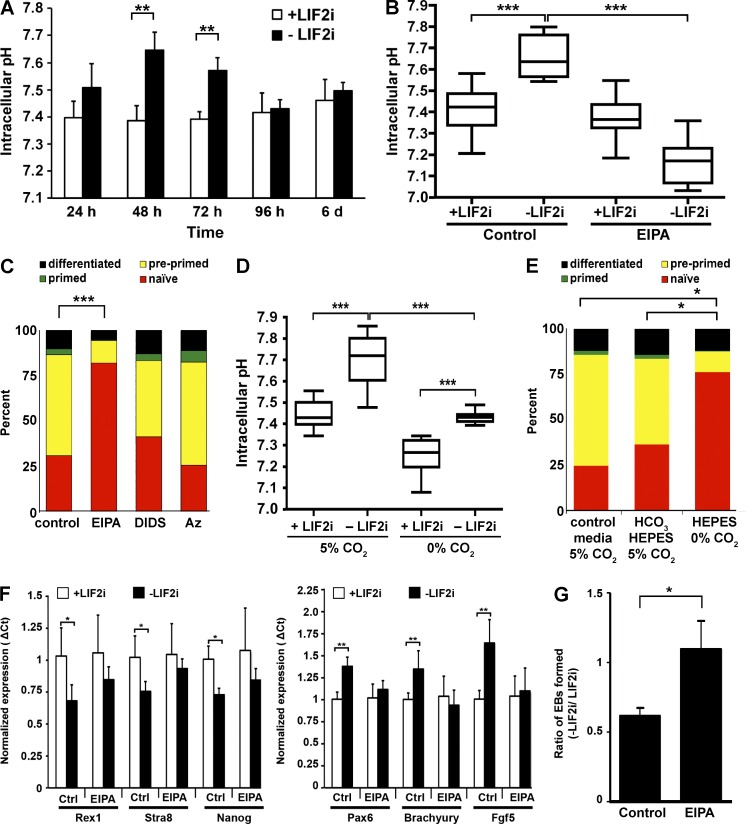
Increased pHi during mESC differentiation is necessary for progression to primed fate. (A) pHi measurements revealed no significant change over 6 d with LIF2i but significant increases at 48 and 72 h after removing LIF2i. n = 3 cell preparations. (B) EIPA blocked the increase in pHi seen at 72 h after removal of LIF2i. n = 5 cell preparations. (C) In the dual-reporter mESC line, naive mESCs expressed mir-290-mCherry; preprimed cells expressed both mir-290-mCherry and mir-302-eGFP; primed cells expressed mir-302-eGFP; and further differentiated cells have silenced both reporters. After 72 h without LIF2i, 30.9% of control cells and 82.0% of EIPA-treated cells expressed mir-290-mCherry alone. n = 6 cell preparations. (D) Cells maintained for 72 h in Hepes-buffered DMEM in the absence of CO2 had lower pHi in the presence and absence of LIF2i compared with cells maintained at 5% CO2. n = 4 cell preparations. (E) In the dual-reporter mESC line, more cells maintained in Hepes-buffered DMEM in the absence of CO2 expressed in the naive cell miRNA mir-290-mCherry (75.4%) compared with cells maintained at 5% CO2 in either a predominantly Hepes-buffered DMEM (36.4%) or control DMEM (24.6%). n = 3 cell preparations. (F) Naive markers (Rex1, Stra8, and Nanog) were expressed at significantly lower levels, and differentiation markers (Pax6, T, and Fgf5) were expressed at significantly higher levels in control cells maintained without LIF2i for 72 h compared with naive cells maintained with LIF2i. In contrast, in the presence of EIPA, naive marker expression did not decrease, nor did differentiation marker expression increase upon removal of LIF2i. (G) Functional pluripotency, as measured by EB formation, is maintained in the presence of EIPA. The number of EBs formed after 72 h without LIF2i was normalized to the number of EBs formed in naive mESCs for each experiment. Control mESCs form fewer EBs than naive mESCs (61 ± 5%). However, mESCs grown without LIF2i but with EIPA for 72 h form EBs as well as naive mESCs (109 ± 20%; P < 0.05). Error bars are mean ± standard deviation; n = 130–150 droplets; n = 3 independent experiments. Box plots display mean ± SEM. *, P < 0.05; **, P < 0.01; ***, P < 0.001 (t test).

