
Fig. 3.
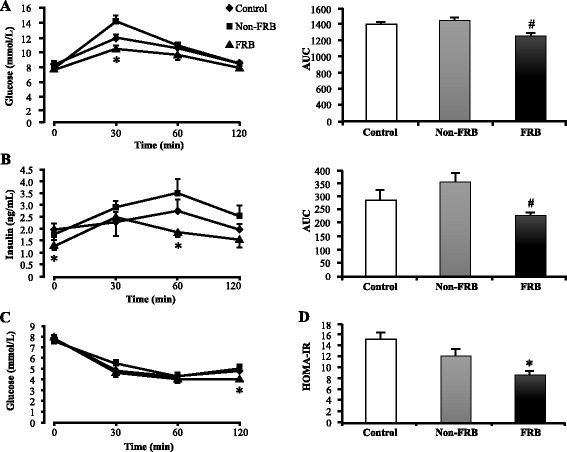
Effects of FRB on plasma glucose and insulin levels. a Plasma glucose levels after oral glucose tolerance test (OGTT) (left) and the resulting area under the curve (right). b Plasma insulin levels after OGTT (left) and the resulting area under the curve (right). c Plasma glucose levels after insulin tolerance test (ITT). d Homeostatic model assessment of insulin resistance (HOMA-IR) index. Values are expressed as mean ± SEM (n = 6). *, # P < 0.05 compared to control, Non-FRB. FRB fermented rice bran, Non-FRB non-fermented rice bran, SEM standard error of the mean