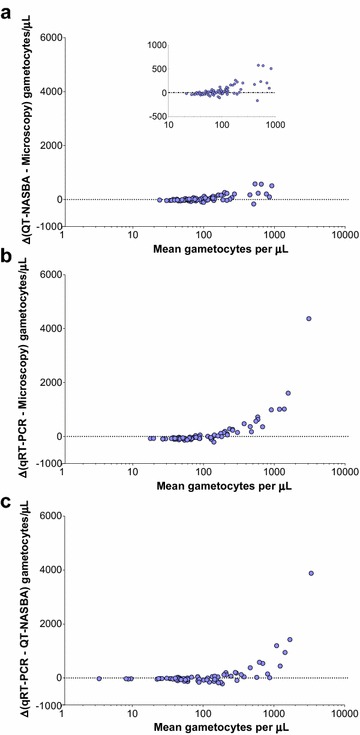
Fig. 2.

Bland-Altman plots to assess agreement between light microscopy, QT-NASBA and qRT-PCR levels in samples from naturally infected individuals. In the y-axes, differences between gametocyte levels estimated by two different methods are presented: a QT-NASBA levels minus microscopy-defined densities, b qRT-PCR minus microscopy levels, c qRT-PCR levels minus levels estimated by QT-NASBA. The X-axes present the average of the densities estimated by the two methods included in the calculation of the respective Y-axes. In panel a, the differences (Y-axis) are limited to a narrower range of values compared to panels b and c, and the inset plot presents the same data using different Y-axis limits
