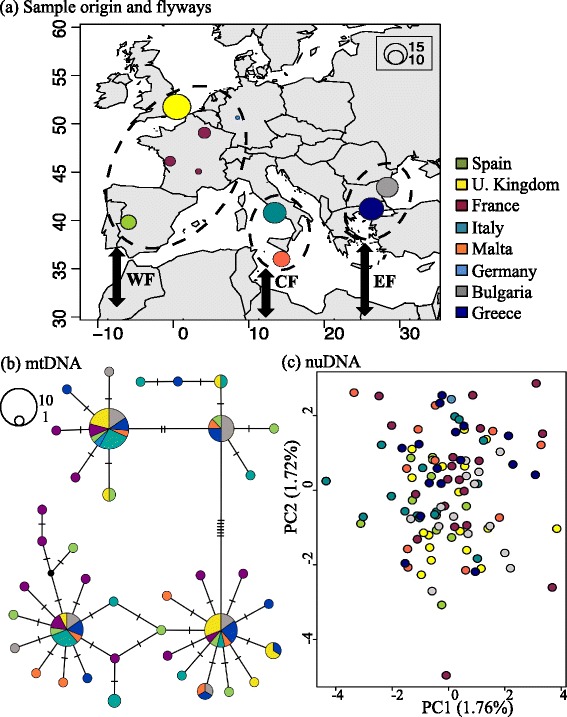
Fig. 1.

Sampling localities and population genetic structure from mitochondrial and nuclear data. Legend: a Coloured circles indicate sample origin; circle sizes are scaled to sample size. Dashed ovals group the sampling localities according to the three main flyways (represented with arrows): western, central and eastern (WF, CF and EF, respectively). b Median joining network based on cytochrome b haplotypes (mtDNA), hatch marks on the lines connecting circles indicate mutational steps. c Principal component analysis based on SNP data (nuDNA)
