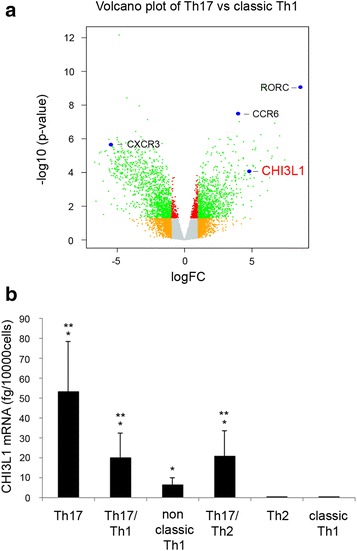
Fig. 1.

CHI3L1 is expressed by Th17 and Th17-derived cells. a Volcano plot representation (log fold change vs. −log 10 p value) of Th17 and classic Th1 cells gene expression profiles. b CHI3L1 mRNA expression was evaluated by real time quantitative RT-PCR on Th17 (n = 14), Th17/Th1 (n = 7), non classic Th1 (n = 9), Th17/Th2 (n = 8), Th2 (n = 5) and classic Th1 (n = 15) clones. Columns represent mean values (±SE). *p ≤ 0.05 compared to classic Th1 column; **p ≤ 0.05 compared to Th2 column
