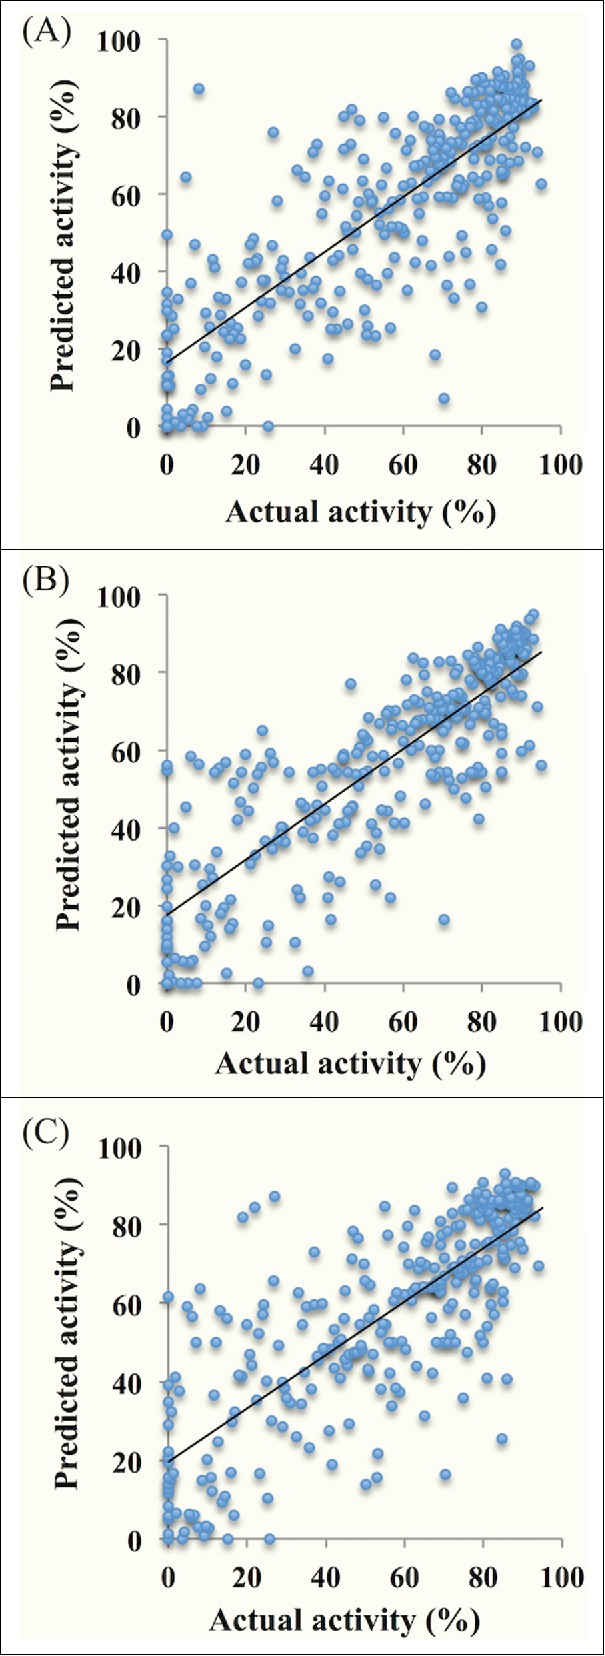
Figure 2.

Scatter plot of percentage activities between actual and predicted chemically modified siRNA activities from independent validation data set Hetero-V303. (A) Model-A; Mononucleotide nucleotide composition (MNC); (B) Model-B; Composition (MNC) and antisense strand binary (5′-end 13 nucleotides); (C) Model-C; Composition (MNC) and antisense strand binary (3′-end 8 nucleotides).
