
Figure 4.
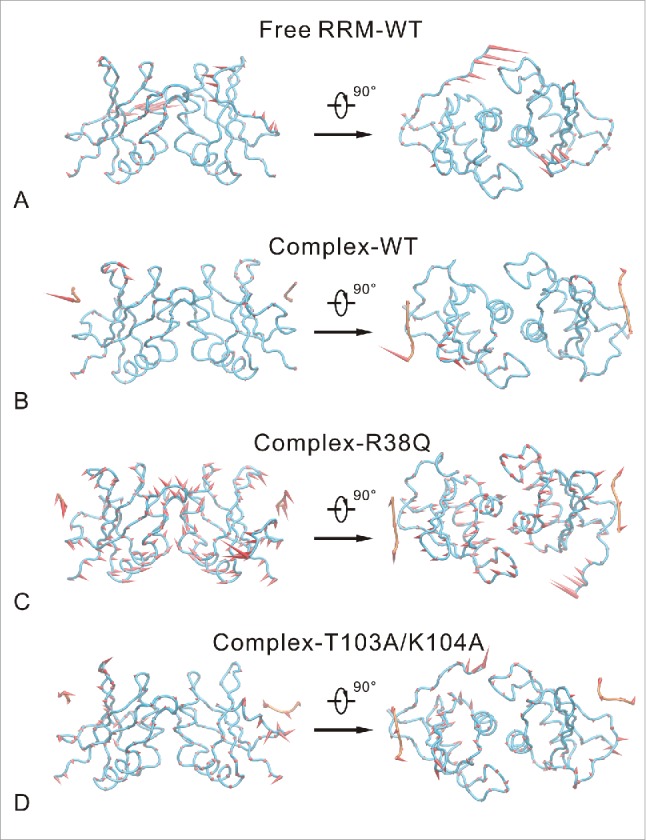
First slowest motion modes of free RRM-WT (A), complex-WT (B), complex-R38Q (C) and complex-T103A/K104A (D) systems. The average structure is depicted with tube model. RRM domain and RNA are colored blue and orange, respectively. The motion modes are shown as cone model and colored red. The length of cone is positively correlated with the motion magnitude, and the orientation of cone indicates the motion direction.