
Figure 6.
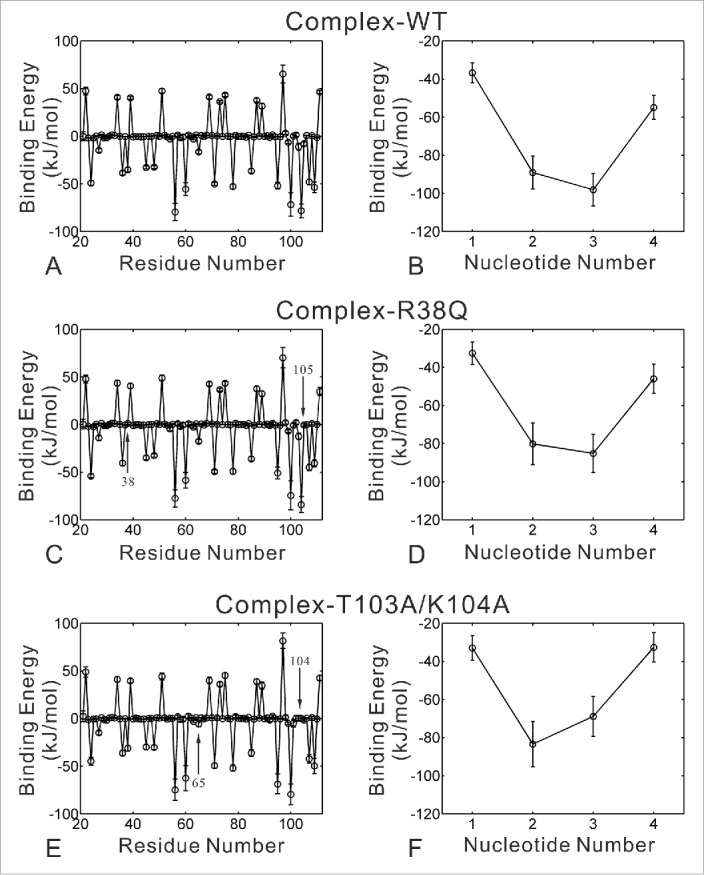
Binding energy decomposition of complex-WT (A-B), complex-R38Q (C-D) and complex-T103A/K104A (E-F) systems. Energetic contributions of residues in RRM domain are shown in the left figures (A), (C) and (E). Energetic contributions of nucleotides in RNA are shown in the right figures (B), (D) and (F). Energies are given as kilojoules per mole. Error bars represent the standard deviations of the energies.