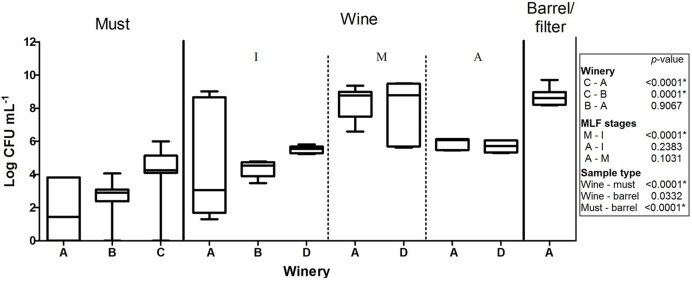
FIGURE 1.
Population of lactic acid bacteria in samples of must, barrel/filter and wine throughout three stages of malolactic fermentation: I beginning, M intermediate, A advanced; obtained from wineries (A–D). Kruskal–Wallis analysis and Dunn’s post hoc test among wineries, MFL stages and sample type. The box indicates the 25th and 75th percentiles, line across the box shows the median value and the whiskers caps represent the maximum and minimum values.

