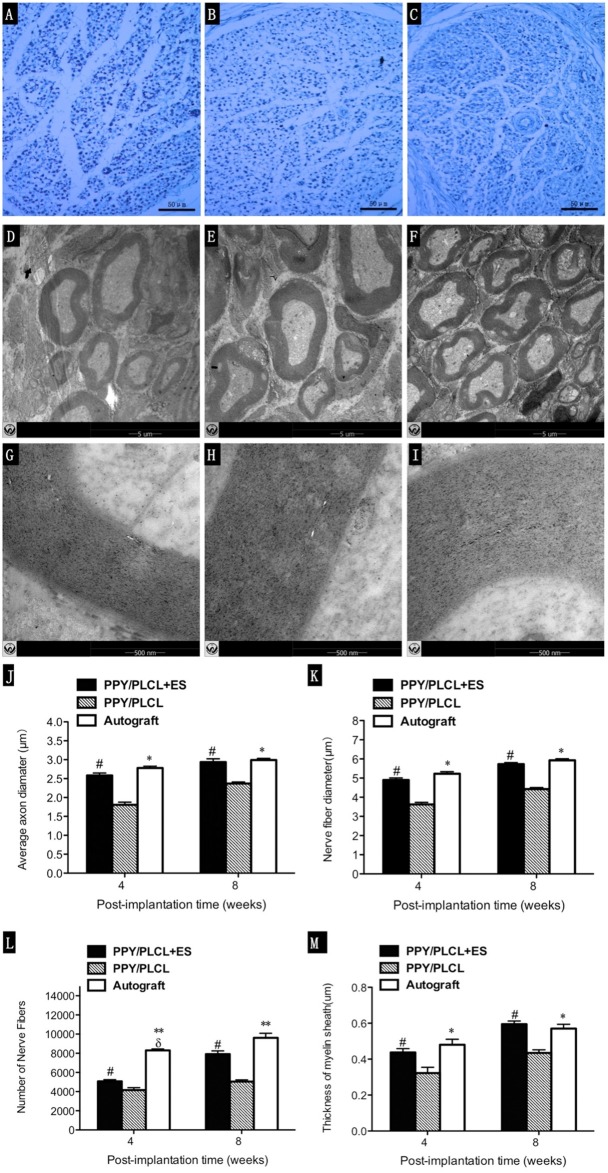
Figure 7.
Histology images stained with toluidine blue and transmission electron microscopy (TEM) micrographs. Images represent cross sections of regenerated nerves taken from different conduits in rats at 8 weeks post-implantation. (A,D,G) From the PPY/PLCL group, (B,E,H) from the PPY/PLCL + ES group and (C,F,I) from the autograft group. Histology scale bar: 50 μm (A–C). TEM scale bar: 5 μm (D–F), 500 nm (G–I). (J) Average axon diameter. (K) Nerve fiber diameter. (L) Number of nerve fibers. (M) Thickness of myelin sheath (n = 5, #p < 0.05 the PPY/PLCL + ES group vs. PPY/PLCL group; *p < 0.05, **p < 0.01 the autograft group vs. PPY/PLCL group; δp < 0.05, the autograft group vs. PPY/PLCL + ES group).

