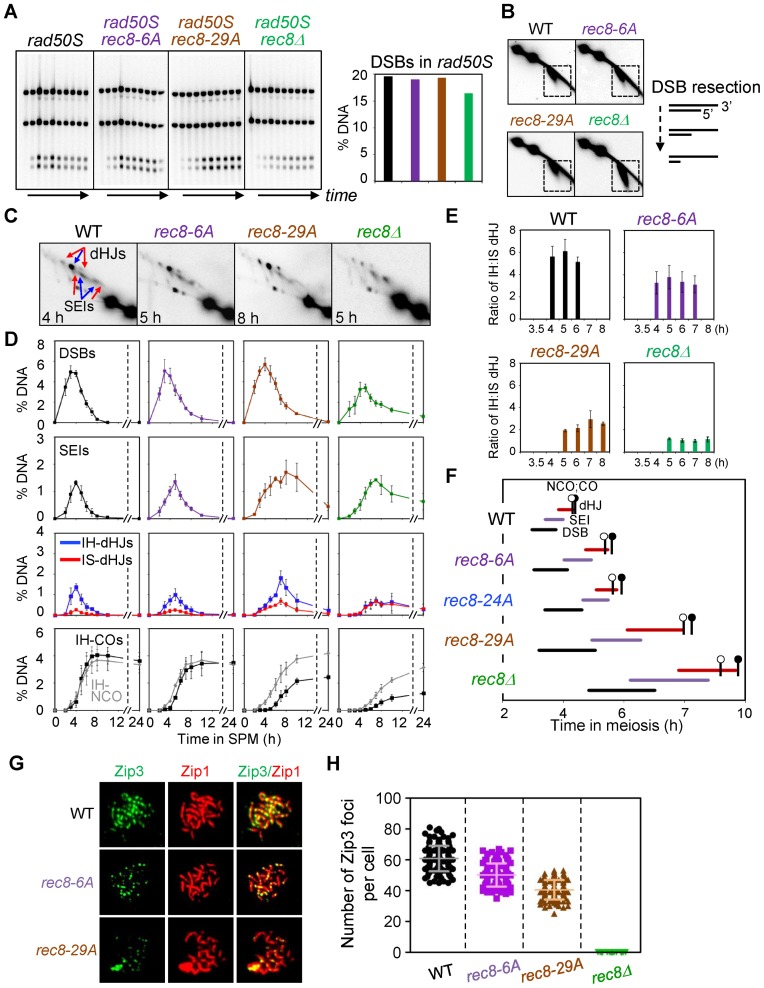
Figure 3.
Analysis of meiotic recombination in rec8 phospho-mutant strains. (A) Analysis of DSB formation in rad50S strains. (Left) 1D gel analysis of rad50S DSBs. (Right) Quantification of DSB levels in the left gel analysis. (B) 2D-gel analysis of DSB resection in WT and indicated single mutants. Illustration shows DSB resection of 5′-termini to generate 3′-single-strand DNA tail. (C) Representative 2D gel images for WT and mutant strains. (D) Quantitative analysis of DSBs, SEIs, dHJs, IH-COs and IH-NCOs from meiotic time courses (mean ± SEM for three cultures). ‘% DNA’ in Y-axis of the plot indicates the percentage of total hybridizing signals. (E) Ratio of IH/IS dHJ over time plotted as percentage maximum level (mean ± SEM for three cultures). (F) Timing and kinetics of recombination events in each of the strains. Relative timing of DSBs, SEIs, dHJs, IH-COs and IH-NCOs were analyzed as described (4,30). The lifespan of each recombination event was measured by the timing of the length, beginning and end of recombinant DNA formation. IH-CO and IH-NCO products are marked by black and blank circles, respectively, to denote their appearance and disappearance in approximately 50% of cells. (G) Representative images showing Zip3 foci and Zip1 array of spread chromosome in each indicated strains immunostained for Zip3-13myc and Zip1. (H) Quantification of the number of Zip3 foci in WT (sampled at 5 h), Rec8-phospho mutants (sampled at 6 h for rec8-6A and at 7 h for rec8-29A) and rec8Δ (sampled at 7 h). Scatter plots show the number of Zip3 foci at pachytene chromosomes (mean ± SD, n = 100–150 nuclei). Each symbol indicates a numerical value for individual nuclei.

