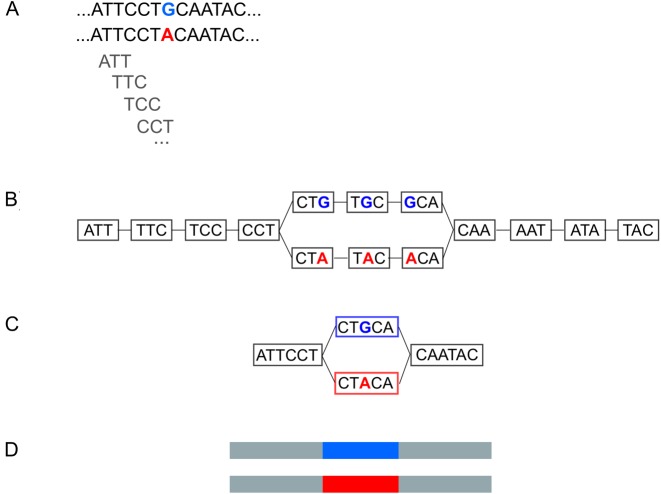
Figure 2.
(A) A SNP present in two alleles in the data. (B) The de Bruijn Graph derived from the data. For the sake of simplicity of exposition, we draw here with k = 3. In practice, k = 41. (C) A compressed de Bruijn graph can be obtained by merging nodes with a single outgoing edge with nodes with a single incoming edge. This compression step is lossless. (D) The two paths in the compressed de Bruijn graph correspond to the two alleles of the SNP.

