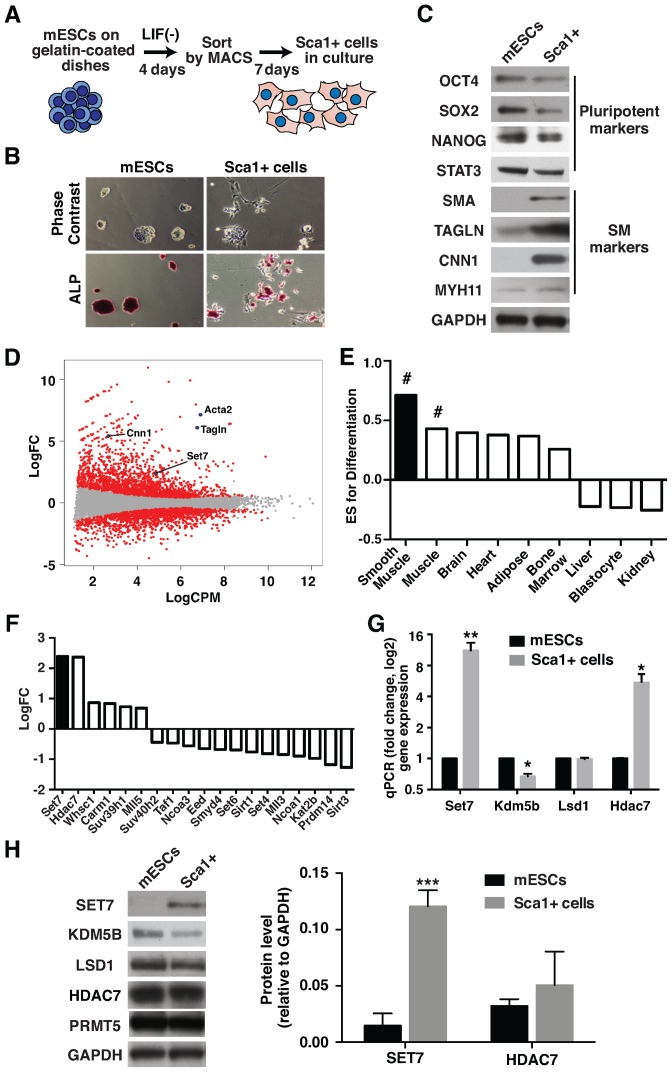
Figure 1.
Set7 is up-regulated during Sca1+ cell differentiation. (A) Schematic representation of the experimental procedure for Sca1+ cell differentiation. Mouse ESCs were cultured without LIF on gelatin-coated dishes for 4 days. Sca1+ cells were isolated by magnetic activated cell sorting (MACS) using anti-Sca1 immunomagnetic beads, followed by incubation with growth medium for 7 days. (B) Morphological changes of mESC differentiation to Sca1+ cells. Upper panel indicates the representative phase contrast images of mESC and Sca1+ cells. Loss of alkaline phosphatase (ALP) staining was observed during differentiation (Bottom panel). Original magnification, 40X. (C) Protein expression profiles derived from mESC and Sca1+ cells. Immunoblot analysis of cell lysates prepared from mESC and Sca1+ cells was performed using antibodies specific to OCT4, SOX2, NANOG, STAT3, SMA, Transgelin (TAGLN), Calponin (CNN1) and MYH11. GAPDH was used for protein loading control. The results shown represent three independent experiments. (D) Genome-wide expression analysis for mESC differentiation to Sca1+ cells. RNA-Sequencing (RNA-Seq) was performed from mESC and Sca1+ cells. MA plots show the Log2 fold change (LogFC) and Log2 counts per million (LogCPM) derived from mESCs and Sca1+ cells. Significant changes in expression (up- and down-regulated genes with a P-value < 0.05) are highlighted in red. (E) Gene set enrichment analysis (GSEA) of Sca1+ cell differentiation based on tissue type (smooth muscle, adipose, heart, muscle, brain, kidney, liver, blastocyte and bone marrow). A positive Enrichment Score (ES) indicates gene sets up-regulated in Sca1+ cells. # FDR q-value = 0.01. (F) RNA-Seq identifies differentially expressed genes in mESC and Sca1+ cells that are implicated in histone tail modification. Signal shown represents the LogFC of normalized read counts of genes in Sca1+ cells. (G) Increased Set7 and Hdac7 expression in Sca1+ cells. mRNA levels of the histone methyltransferase (Set7), demethylase (Lsd1, Kdm5b) and deacetylase (Hdac7) were assessed by quantitative RT-PCR (qRT-PCR) using Gapdh as the internal control. Gene expression was normalized against mESCs. (H) Protein expression of histone modifiers during Sca1+ cell differentiation. Immunoblot analysis of cell lysates prepared from mESC and Sca1+ cells was performed using antibodies specific to SET7, KDM5B, LSD1, HDAC7 and PRMT5 (left panel). GAPDH was used as a loading control. The results shown are a representative of three independent experiments. Quantification of SET7 and HDAC7 protein levels in mESC and Sca1+ cells (right panel). Protein blotting signals were quantified by an infrared imaging system. Data are presented as a ratio SET7 and HDAC7 relative to GAPDH signal. Error bars represent the standard error of the mean of at least three independent experiments. *P < 0.05, **P < 0.01 and ***P < 0.001.

