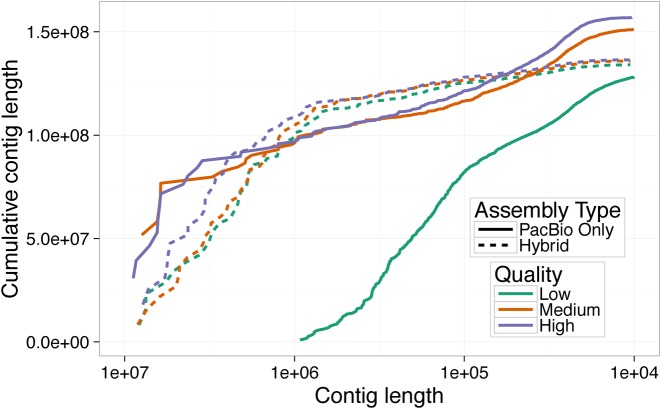
Figure 6.
As in Figure 2A, a plot of cumulative length distribution. These curves represent the cumulative length distribution of final assemblies using low, medium and high quality selected reads using either PacBio only assembly or hybrid assembly.

