Figure 2.
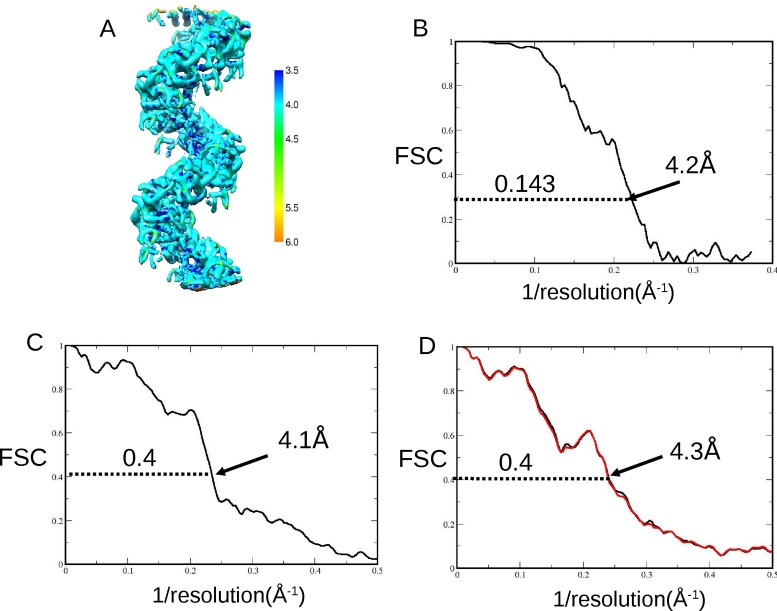
Resolution of the map and the fitted PDB coordinates with overfitted noise estimation. (A) Local resolution map calculated by RESMAP (32) shows the resolution range across the map from 3.5Å to 5Å. (B) Plot showing the Fourier shell correlation (FSC) indicating a final average map resolution of 4.2Å at a cutoff of 0.143 as calculated in RELION by the ‘gold-standard’ technique (30). (C) Plot showing an FSC between a masked, unfiltered area of our EM density map and an EM-derived HRad51 fitted PDB of three monomers with DNA. The cutoff of 0.4 now generally used (e.g. 31) in place of the earlier value of 0.5 indicated a fit good to 4.1Å between the fitted PDB coordinates and the EM density map. (D) Cross-validation to estimate the amount of overfitted noise was carried out. This works by firstly ‘shaking’ the refined PDB coordinates randomly by 0.5Å before refinement in REFMAC then conversion to EM density. FSC are computed between the new ‘shaken’, refined and converted EM density and each of the half maps from the refinement step in RELION (33). The plot shows the black line from half map 1 is very close to the red line from half map 2, indicating that there is little or no overfitted noise in our structure. The cutoff at 0.4 is shown at 4.3Å.

