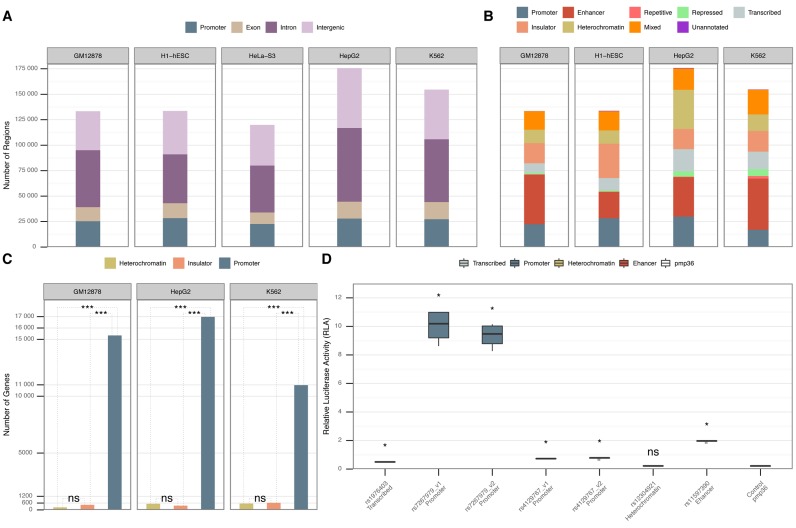
Figure 1.
(A) Annotation of the putative regulatory regions for each of the five cell lines according to their proximity to GENCODEv23 genes (26). (B) Annotation of putative regulatory regions according to the merged annotations from the ChromHMM data set (cf. Materials and Methods). The regions that did not intersect with any of the ChromHMM annotations are marked as “Unannotated". We lack ChromHMM annotations for HeLa-S3. (C) Pair-wise comparison of gene expression differences among ChromHMM heterochromatic, insulator and promoter putative regulatory regions located in physical promoters (Supplementary Note S4). The Y-axis represents the number of physical gene promoters intersecting with heterochromatic, insulator or promoter putative regulatory regions in three different cell lines. The P-value shows the statistically significant difference (Wilcoxon rank-sum test) between gene expression levels in heterochromatin, insulator and promoters according to ChromHMM. “ns" denotes that there was no statistical significance between the gene expression levels. (D) Biological validation of a subset of the proposed regulatory regions by tfNet. The information in the X-axis contains the GWAS reference SNP IDs (rs) for the SNPs located within the regulatory regions and the ChromHMM annotation. The Y-axis shows the relative luciferase activity for each tested region. P-values are calculated between the control and each corresponding tested region (Mann–Whitney U test). “ns" denotes that there was no statistical significance between the tested region and the control.

