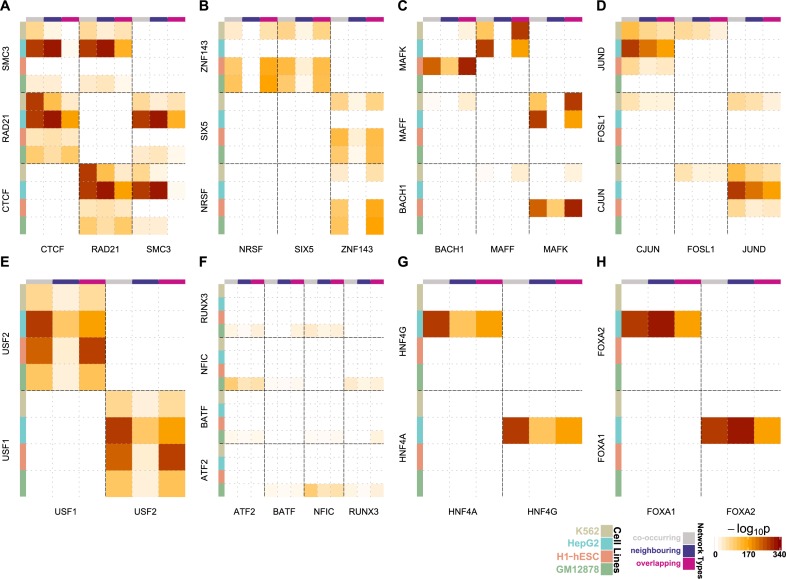
Figure 2.
Heatmap networks modelling the significant TF–TF interactions in putative regulatory regions of heterochromatin annotation. The colour intensity in each cell represents the TF–TF interaction significance for each network type in the corresponding cell line. The shown interactions are between (A) CTCF-RAD21-SMC3, (B) NRSF-SIX5-ZNF143, (C) BACH1-MAFF-MAFK, (D) CJUN-FOSL1-JUND, (E) USF1-USF2, (F) ARF2-BATF-NFIC-RUNX3, (G) HNF4A-HNF4G and (H) FOXA1-FOXA2.

