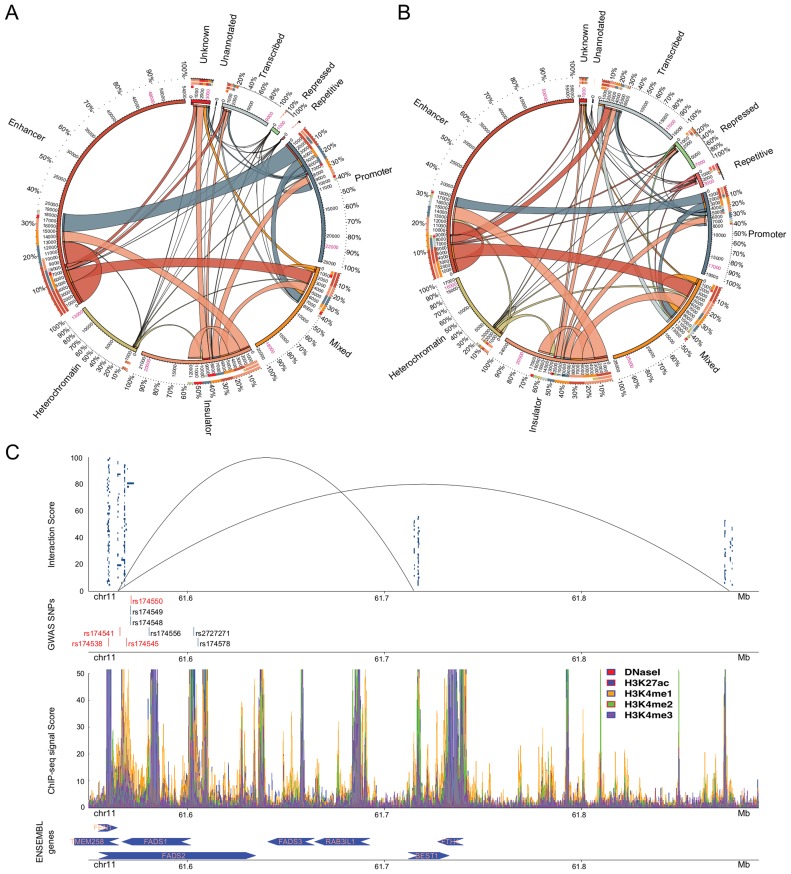
Figure 3.
Participation of the putative regulatory regions (including DNaseI) in interacting domains for (A) GM12878 and (B) K562 (27,57). Region annotations are shown outside the circles. The percentages show the participation of regulatory regions of each annotation. The numbers between the inner and the outer circle represent the amount of putative regulatory regions of a specific annotation interacting with other annotated regions. Putative regulatory regions participating in multiple interactions have been counted multiple times while the numbers in pink stand for the actual amount of putative regulatory regions detected by tfNet. The colour code for the putative regulatory region annotations is the same as in Figure 1B. The thickness of the ribbons shows the number of interacting regions of each annotation. The arks of the innermost circle denote the edges of the corresponding ribbon. (C) Enrichment of GWAS SNPs in putative regulatory regions of interacting domains. In the first track, the blue-box clusters represent ChIP-seq peaks constituting regulatory regions located in the chromatin interacting domains. The lines show the three-dimensional interactions between the upstream and the two downstream domains (Supplementary Table S8). The GWAS SNPs enriched in the regulatory regions are shown in the second track. The red bars are harboured by regions within the interacting domains while those in blue harboured by the nearby regions. In the third track enrichment of histone modification and DNaseI signals are shown. In the final track the ENSEMBL genes close to the looping domains are shown. The arrows show the transcription direction.

