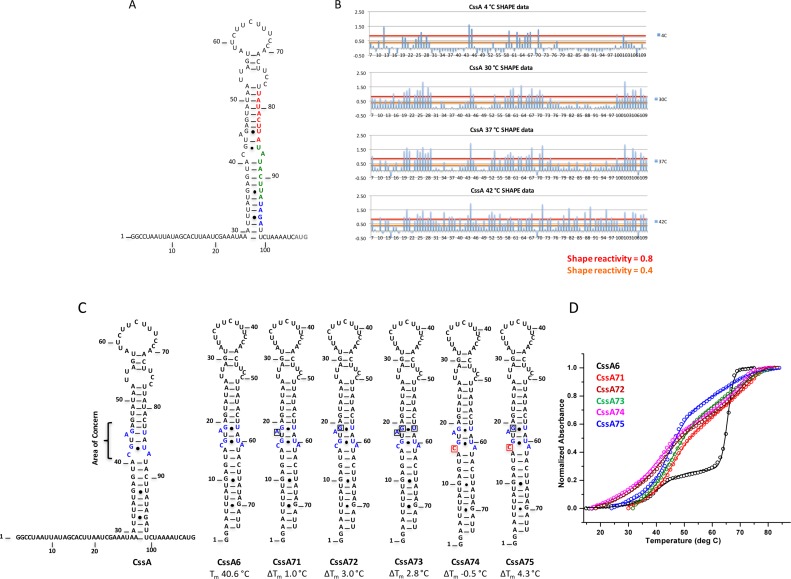
Figure 2.
Per residue SHAPE reactivity and mutations introduced to stabilize the structure of the CssA thermometer. (A) Secondary structure of the CssA thermometer as predicted by mfold (35). Red and green colored nucleotides correspond to the two copies of the 8 bp sequence (TATACTTA), whereas blue colored nucleotides correspond to the RBS. The dark gray colored AUG represents the translation start site. (B) Quantification of SHAPE reactivity over the temperature range 4–42°C. Reactivity is classified as follows: 0.4–0.8 and >0.8 correspond to reactive and highly reactive sites, respectively. At 4°C, nucleotides at the 5′ and 3′-single stranded regions, the apical loop and the internal AG-U are chemically modified, indicative of a flexible, open structure; as the temperature increases, the flexibility spreads from the apical loop further down the structure; by 42°C, the entire RNA structure becomes reactive. (C) Secondary structure of various mutated thermometers (CssA6, 71, 72, 73, 74 and 75), where single nucleotide substitutions were introduced to alter the thermodynamic stability of the thermometer. Except for CssA74, all mutations generated a more stable RNA. The area highlighted in blue within the secondary structure is the region where mutations were introduced. Red colored nucleotides represent the mutated residue. (D) Thermal melting results for CssA6, CssA71, CssA72, CssA73, CssA74 and CssA75, shown in black, red, wine, olive-green, magenta and blue colors, respectively The CssA thermometer and its variants have two unfolding transitions around 39–45°C and 69°C, as is most evident in the black melting curve corresponding to CssA. This behavior is due to the formation of a dimeric, more stable RNA structures at the concentrations required for optical melting studies, which are not physiologically relevant.

