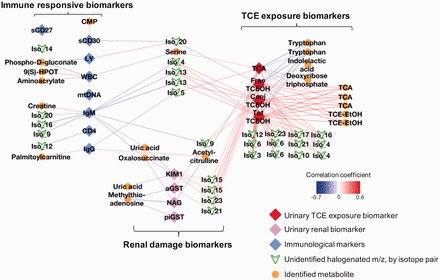
Figure 4.

Network correlation analysis of molecular markers previously tested for association with TCE exposure and metabolic features detected in this study. Only correlations with Spearman |r| ≥ 0.3 and P-value ≤ 0.05 corresponding to identified metabolites or probable halogens were included. Immune markers: CD4 = CD4+ T cell count; IgG, immunoglobulin G; IgM, immunoglobulin M; LY, lymphocyte cell count; mtDNA, mitochondrial DNA turnover rate; sCD27, soluble CD27; sCD30, soluble CD30; WBC, white blood cell count. Nephrotoxicity markers: aGST, urinary α glutathione-s-transferase; piGST, urinary pi glutathione-s-transferase; KIM1, urinary kidney injury marker 1; NAG, urinary n-acetyl-beta-glucosaminidase. TCE exposure markers: Conj. TCEOH: urinary trichloroethanol glucuronide; Free TCEOH: urinary trichloroethanol; Tot TCEOH: sum of urinary trichloroethanol and trichloroethanol glucuronide; TCA: urinary trichloroacetic acid.
