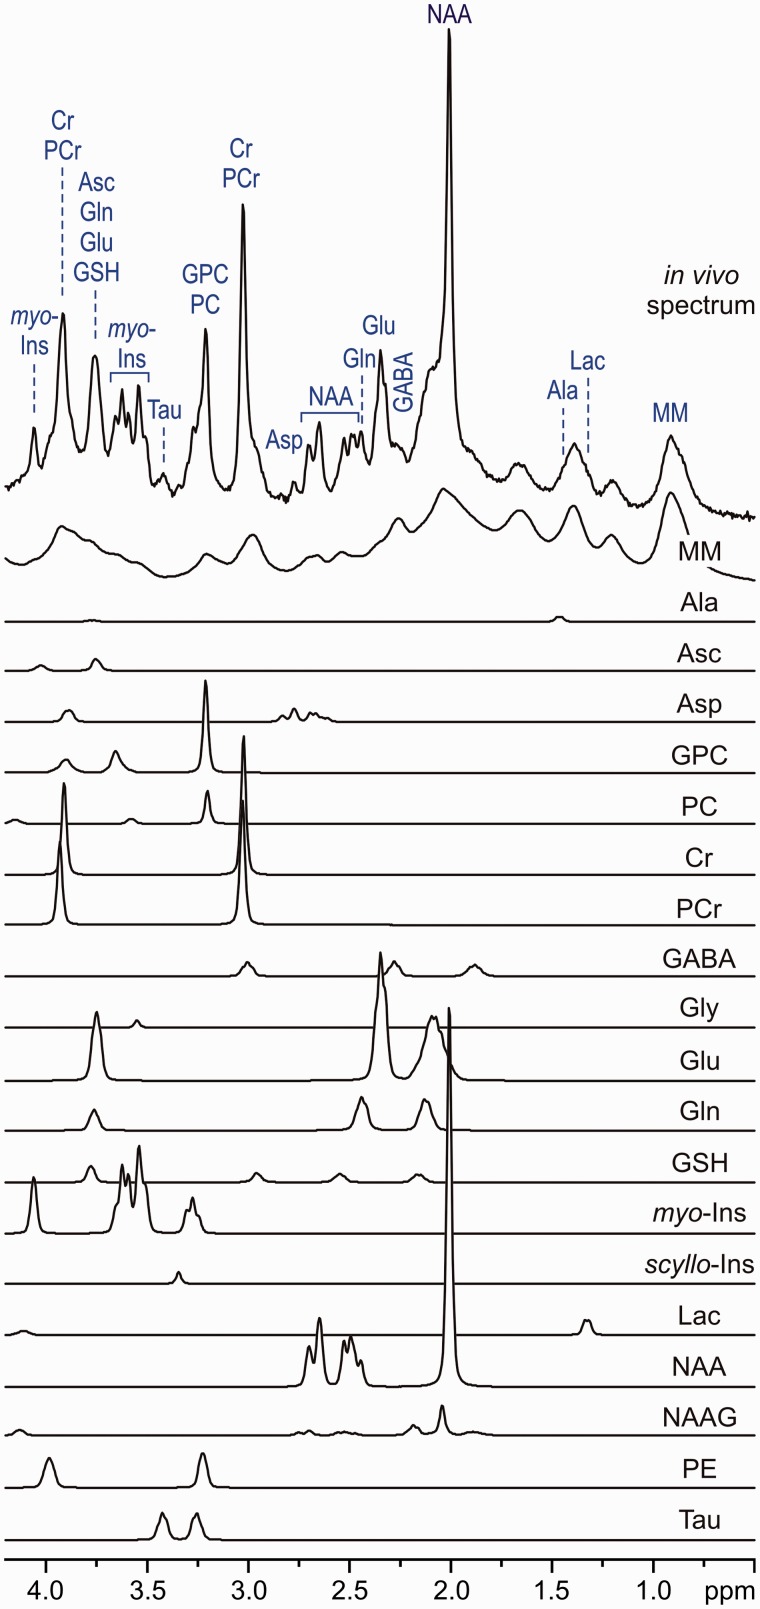
Figure 3.
LCModel analysis of an in vivo 1H MR spectrum acquired from the human brain at 7 T (STEAM, TE = 6 ms, TR = 5 s, NT = 160, grey-matter-rich occipital cortex). In vivo spectrum can be modelled as a linear combination of brain metabolite spectra from the LCModel basis set: macromolecules (MM), alanine (Ala), ascorbate (Asc), glycerophosphocholine (GPC), phosphocholine (PC), creatine (Cr), phosphocreatine (PCr), γ-aminobutyric acid (GABA), glycine (Gly), glutamate (Glu), glutamine (Gln), glutathione (GSH), myo-inositol (myo-Ins), scyllo-inositol (scyllo-Ins), lactate (Lac), N-acetylaspartate (NAA), N-acetylaspartylglutamate (NAAG), phosphoethanolamine (PE), taurine (Tau). Modified with permission from Tkac et al.25 © 2005 Springer.

