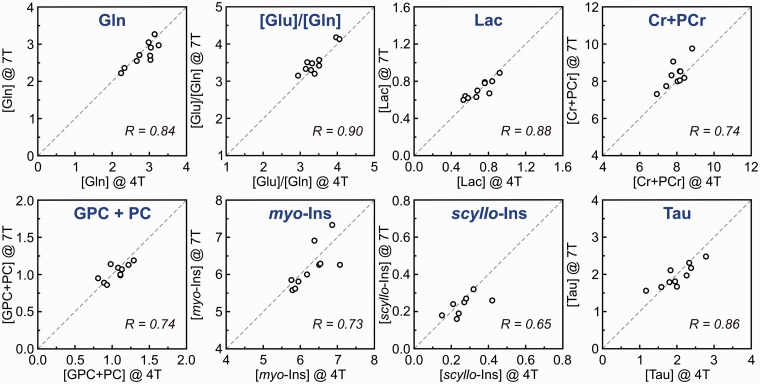
Figure 6.
Correlation between metabolite concentrations and concentration ratios of individual subjects determined from 4T and 7T 1H-MR spectra. Concentrations are expressed in µmol/g. Modified with permission from Tkac et al.26 © 2009 John Wiley and Sons.

