
Figure 4.
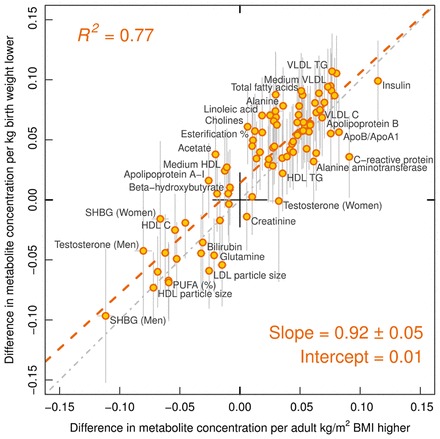
Resemblance between metabolic association patterns related to lower birthweight and higher adulthood BMI (assessed at the same time as blood sampling for metabolic profiling). The metabolic associations were assessed for the same 18 288 individuals. The red dashed line denotes the linear fit between metabolic associations with lower birthweight and higher BMI. The slope indicates that 1kg lower birthweight is on average associated with metabolic deviations similar to those linked with 0.92 kg/m2 higher BMI in adulthood.