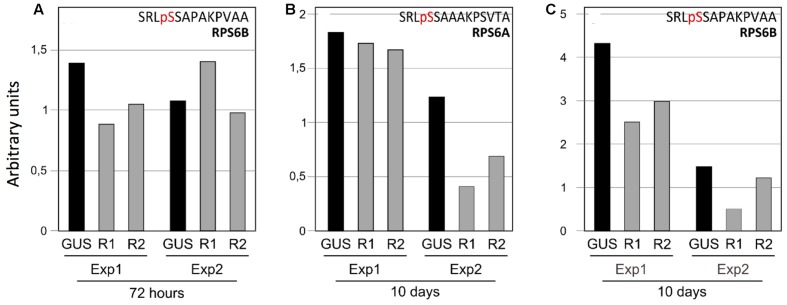
FIGURE 5.
Downregulation of RPS6A and RPS6B phosphorylation in response to TOR inactivation. (A) Phosphorylation level of the RPS6B C-terminal peptide after 72 h of ethanol treatment. (B) Same for the RPS6A and (C) for the RPS6B proteins after 10 days of ethanol treatment. Each bar corresponds to the peak intensity of the phosphorylated peptide normalized by a proteotypic peptide from the same protein (GENDLPGLTDTEKPR for RPS6A and GVSDLPGLTDTEKPR for RPS6B). For each experiment, the results of the GUS control (GUS), the TOR RNAi1 (R1) and the TOR RNAi2 (R2) lines are presented. Exp1 and Exp2 correspond to two independent biological replicates with 72 h or 10 days of TOR inactivation.

