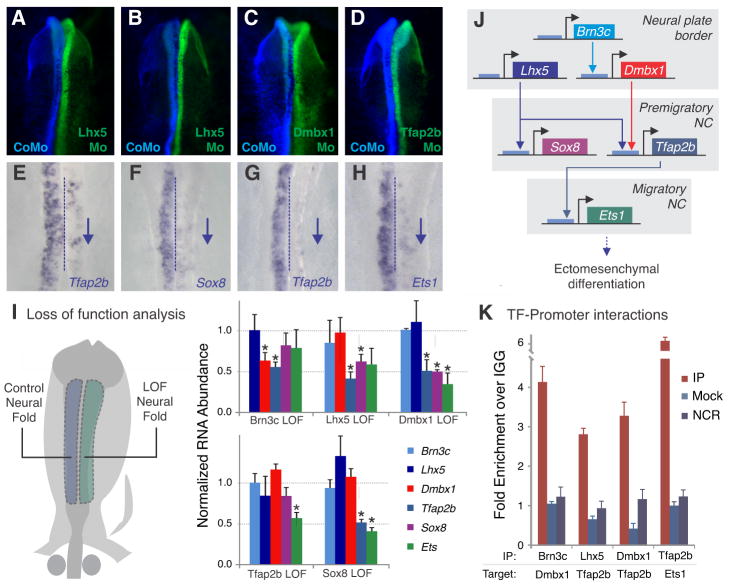
Figure 3. Cranial-specific transcriptional circuit underlying neural crest axial identity.
(A–D) Whole mount dorsal views of embryos after morpholino (Mo) targeted to indicated transcription factor (TF) was transfected to the right side (green) and control morpholino (CoMo) to the left side (blue) of each embryo. (E–H) Same embryos as above after in situ hybridization for indicated downstream TF; blue arrows indicate transcript downregulation. (I) Comparing control to loss of function (LOF) neural folds by qPCR reveals differential regulation of downstream targets with significant changes indicated by * (Student’s t-test, P<0.05). (J) Diagram summarizing cranial specific gene regulatory circuit delineated by functional assays. (K) Chromatin immunoprecipitation (ChIP) demonstrates direct association of cranial specific TFs with promoters of their downstream targets. No enrichment was observed for intergenic negative control regions (NCR), or when the procedure was performed with mock-transfected embryos (see Materials and Methods for more information). Error bars on (I) and (K) represent standard deviation.

