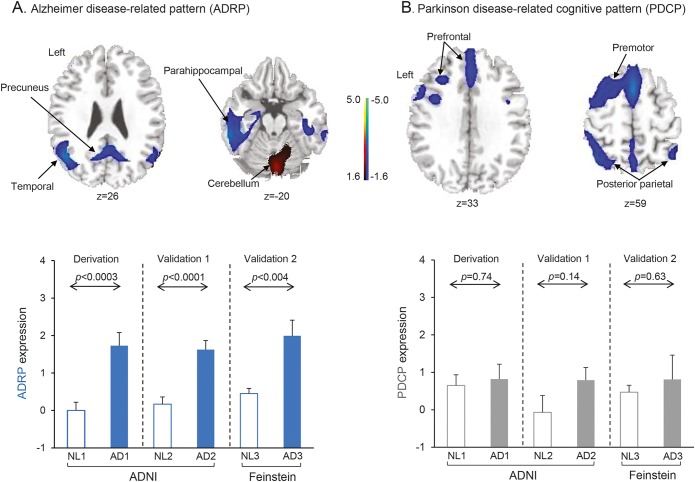
Figure 1. Alzheimer disease (AD)–related pattern (ADRP) expression, but not Parkinson disease (PD) cognition-related pattern (PDCP) expression, is increased in AD.
(A) Top, ADRP, identified by spatial covariance analysis of 18F-fluorodeoxyglucose–PET scans of 20 patients with AD (AD1) and 20 normal controls (NL1) from the Alzheimer’s Disease Neuroimaging Initiative (ADNI), was characterized by reduced activity in the hippocampus, parahippocampal gyrus, and parietal and temporal association regions, with relative increases in the cerebellum, sensorimotor cortex, and supplementary motor area (represented by the second principal component, which accounted for 12.8% of the subject × voxel variation in the data). Voxel weights on the pattern, reflecting local contributions to overall network activity, were found to be stable by bootstrap estimation (absolute value of the inverse coefficient of variation range = [−2.822 to 2.814], p < 0.005, 1,000 iterations). Bottom, In the derivation sample, which comprised 20 patients with AD (AD1) and 20 normal controls (NL1) selected randomly from the ADNI database (see supplemental data), ADRP expression values (subject scores) accurately discriminated patients from healthy controls (p < 0.0003, permutation test). Prospectively computed ADRP subject scores achieved comparable group separation (p < 0.004, Student t test) in 2 separate testing samples. The first testing set comprised the 20 patients with AD (AD2) and 20 normal ADNI participants (NL2) not used for pattern derivation. The second testing set comprised 10 patients with AD (AD3) and 10 normal controls (NL3) scanned separately at the Feinstein Institute. (B) Top, PDCP was previously identified by spatial covariance analysis of metabolic images from 15 patients with PD with varying levels of cognitive dysfunction.15 PDCP is characterized by reduced activity in the presupplementary motor area, premotor, and prefrontal regions and in parietal associative cortex, with relative increases in the cerebellar vermis and dentate nuclei. Bottom, PDCP expression did not differ (p > 0.14) between patients with AD and controls in the derivation sample or in the ADNI and Feinstein validation samples. (The covariance maps shown on the top in A and B were overlaid on T1-weighted magnetic resonance template images. For each pattern, the display was thresholded at |Z| = 1.64 [p < 0.05]. Voxels with positive region weights [relative increases] are color-coded red; those with negative region weights [relative decreases] are color-coded blue. Error bars shown on the bottom of A and B represent 1 SEM.)

