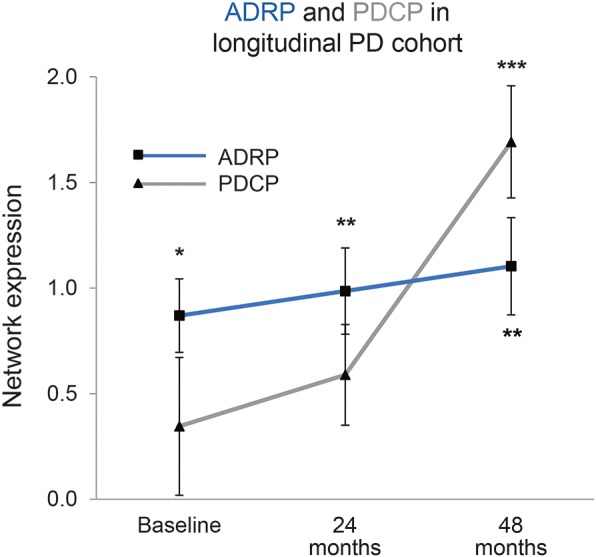
Figure 4. Parkinson disease (PD) cognition-related pattern (PDCP) expression, but not Alzheimer disease–related pattern (ADRP) expression, increases in PD over time.

Mean ADRP (squares) and PDCP (triangles) expression in a longitudinal early-stage PD cohort (see text). PDCP expression values (gray line) increased over time in this group (p < 0.004, repeated-measures analysis of variance [RMANOVA]), while concurrent ADRP changes (blue line) did not reach significance (p = 0.13, RMANOVA). ADRP expression in these patients was elevated relative to control values (p < 0.02, Student t test) at all time points; PDCP expression, in contrast, reached abnormal levels (p < 0.001) only at the final time point. (Error bars represent 1 SE at each time point. *p < 0.05, **p < 0.01, ***p < 0.001, Student t tests compared to normal controls.)
