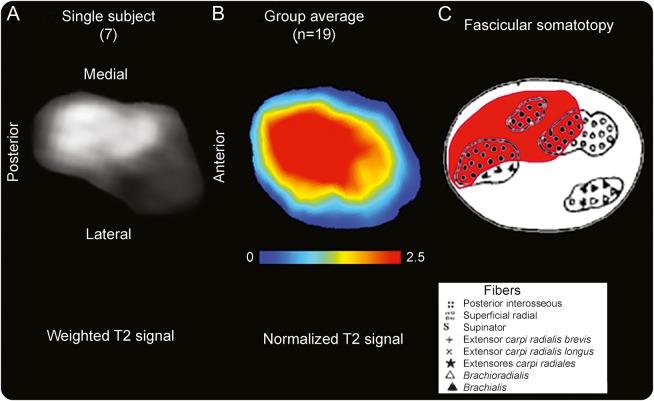
Figure 3. Somatotopy of posterior interosseous nerve fascicular lesions on individual level and group level compared to atlas.
(A) The T2-weighted source image of the radial nerve of patient 7 is shown for the site of predominant lesion focus (9.6 cm proximal to the humeroradial joint). Anatomical orientation is given by labeling ventral/dorsal/medial/lateral contours. (B) Spatial map of the patient group mean normalized T2 signal. This cross-sectional lesion area is at the dorsal/posterior and medial aspect of the radial nerve at the upper arm level with a mean distance of 8.3 cm proximal to the humeroradial joint space. The map was rendered after segmentation and intersubject image registration. (C) Somatotopic/topographic internal map of fascicles of the radial nerve trunk, obtained ex vivo as schematic drawing (modified from Sunderland S. The intraneural topography of the radial, median and ulnar nerves. Brain 1945;68:243–299,29 by permission of Oxford University Press). On this map, the fascicles identified as posterior interosseous fascicles (black filled dots with red background) are in spatial arrangement with the T2 lesion focus on individual (A) and group level (B). Note that lesion focus appears larger on the averaged map compared to historical map partly because of swelling of involved fascicles present in patients but not in specimens used by Sunderland.

