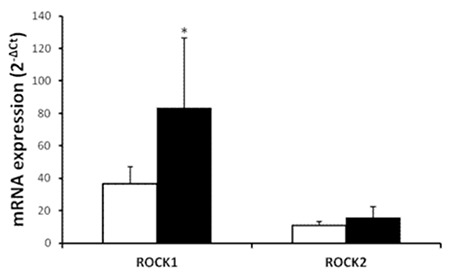
Figure 3. Comparison of the lymph node ROCK1 and ROCK2 gene messenger ribonucleic acid expressions in healthy controls (white bars, n=41) and in patients with mantle cell lymphoma (black bars, n=44). Values are given as mean ± SEM. *p=0.0215 and p=0.9194 values were obtained for ROCK1 and ROCK2 gene, respectively.