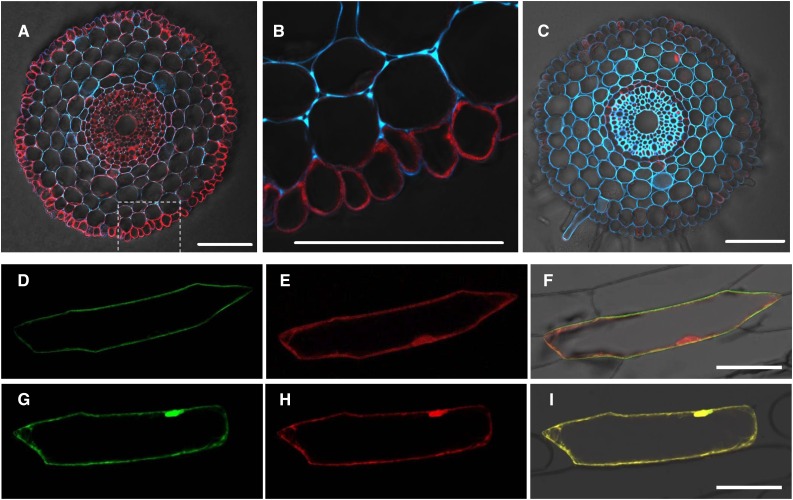
Figure 3.
Cellular and subcellular localization of HvNramp5. A to C, Cellular localization of HvNramp5 in barley roots. Immunostaining with HvNramp5 antibody was performed in root tips (A and B, 2 mm from root tips) and basal roots (C, 15 mm from root tips) of barley (cv Golden Promise). B, High-magnification image of dotted part in A. Red color shows signal from the antibody, while blue color shows autofluorescence of cell wall. Bars = 100 μm. D to I, Subcellular localization of HvNramp5. Confocal images of onion epidermis cells coexpressing HvNramp5-GFP and RFP observed with the GFP (D), RFP (E), and their merged (F) channels, and coexpressing GFP alone and RFP observed with the GFP (G), RFP (H), and their merged (I) channels. Bars = 100 μm.

