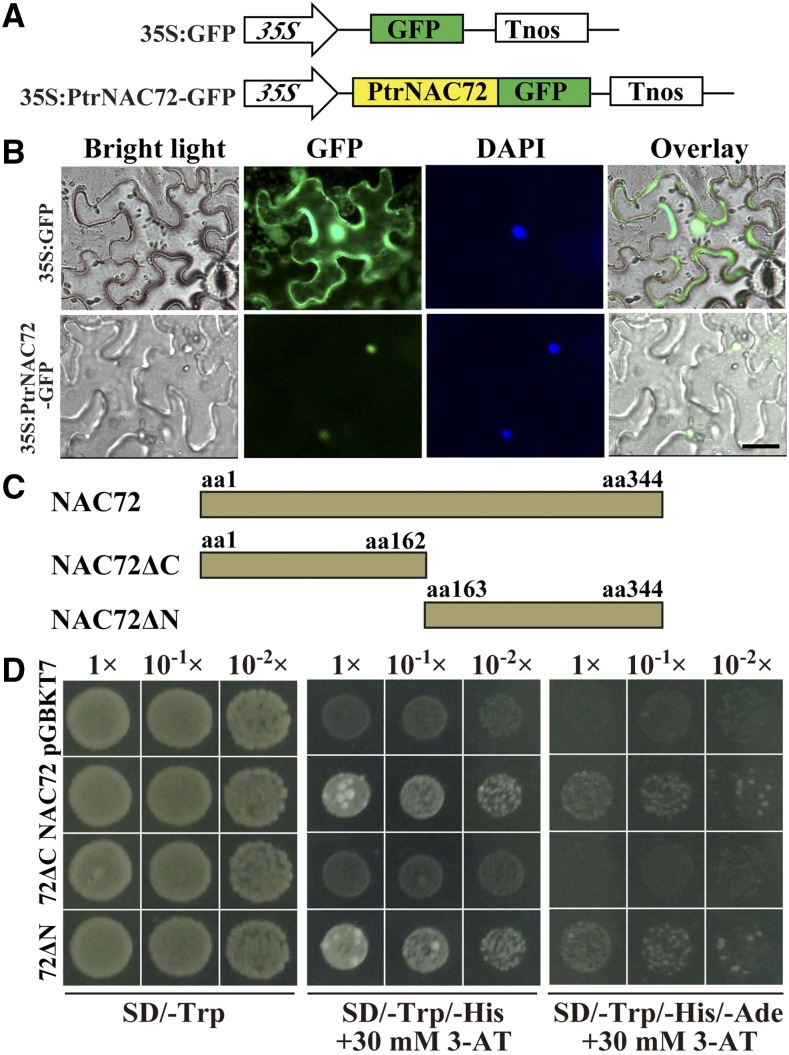
Figure 2.
Subcellular localization and transcriptional activity of PtrNAC72. A, Schematic diagrams of the constructs used for the subcellular localization assay. B, Subcellular localization of PtrNAC72. The fusion construct (35S:PtrNAC72-GFP) and an empty vector (35S:GFP) were transformed into tobacco (Nicotiana benthamiana) epidermal cells via A. tumefaciens-mediated transformation. Images under bright light and GFP fluorescence were taken. 4′,6-Diamidino-2-phenylindole (DAPI) was used to stain the nuclei. The overlaid images are shown on the right. Bar = 20 μm. C, Schematic diagrams of the full-length (NAC72) and truncated (N-terminal part, 72ΔC; C-terminal part, 72ΔN) PtrNAC72, which were fused to the GAL4 DNA-binding domain. aa, Amino acids. The numbers following aa indicate the positions of the amino acids. D, Growth of yeast cells, diluted or undiluted, transformed with different constructs on selective medium, using pGBKT7 as a control.

