Figure 7.
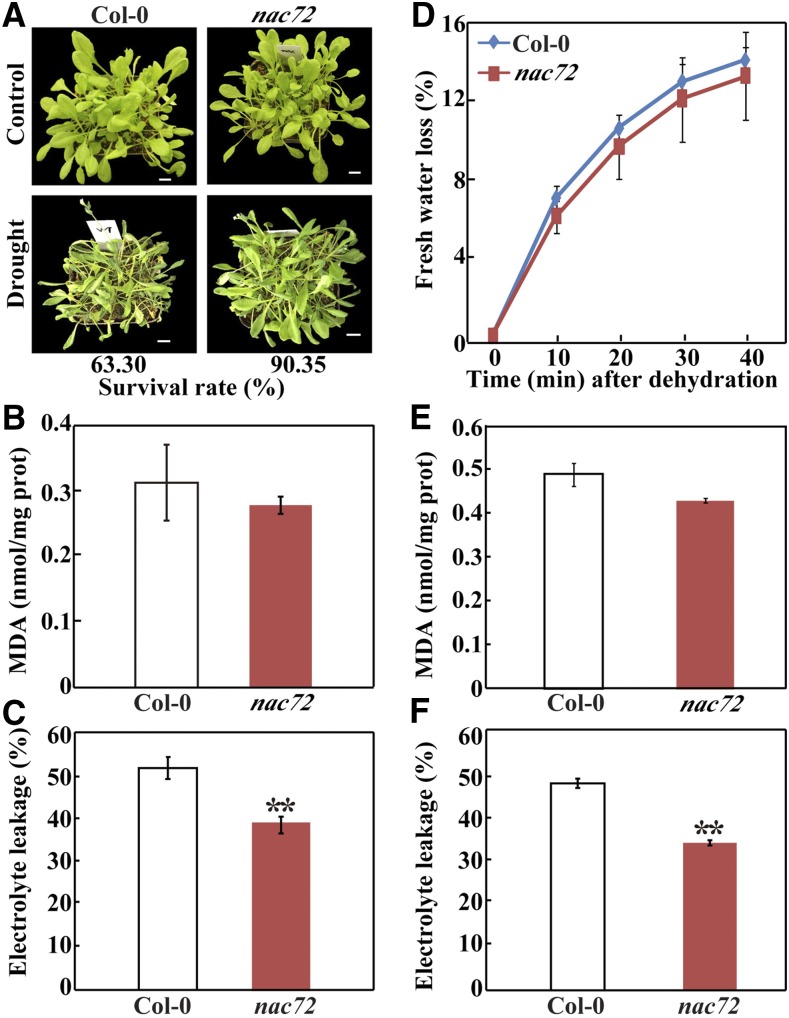
Drought and dehydration tolerance assay of Arabidopsis plants. A, Phenotypes of 30-d-old wild-type (Col-0) and mutant (nac72) plants before (top) and after (bottom) water deprivation for 20 d, followed by rewatering for 3 d. Survival rates of the tested lines are shown below the bottom row. B and C, MDA content (B) and EL (C) of Col-0 and nac72 after drought treatment. D, Water loss rate of Col-0 and nac72 during 40 min of dehydration. For dehydration, the aerial parts of Col-0 and nac72 plants were excised and placed on filter papers in an ambient environment. To quantify water loss, fresh weight was measured every 10 min. E and F, MDA content (E) and EL (F) of Col-0 and nac72 after dehydration treatment. Data are means ± se (n = 3). Asterisks indicate significant differences between Col-0 and nac72 (**, P < 0.05).

