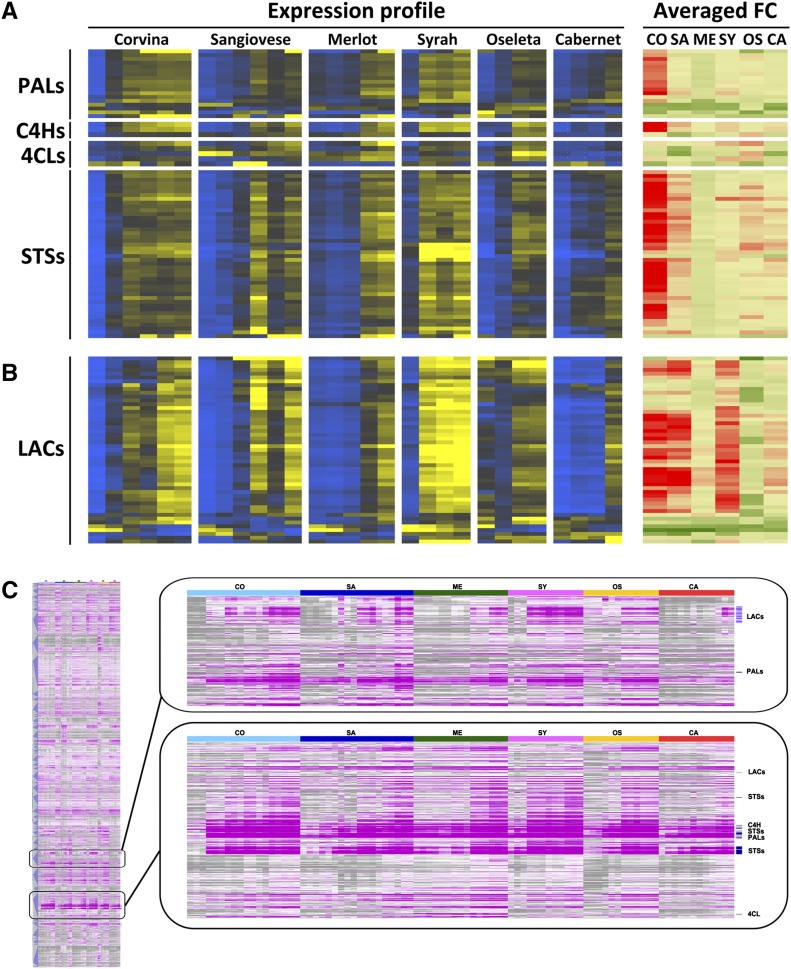
Figure 9.
The phenylpropanoid pathway during grapevine postharvest dehydration in six different varieties. A and B, Heat maps of the expression profile (left: blue indicates low expression while yellow indicates high expression) and the average fold change (right: green indicates low FC while red indicates high FC) for a selection of phenylpropanoid-related genes (A) and laccase genes (B) during the postharvest dehydration process in each variety. C, Hierarchical cluster analysis of differentially expressed genes during dehydration in at least one variety (FDR = 0.1% and |FC| > 2; gray indicates low expression while pink indicates high expression). Enlargements show examples of 2 out of 91 hierarchical clusters. CO, Corvina; SA, Sangiovese; ME, Merlot; SY, Syrah; OS, Oseleta; CA, Cabernet Sauvignon. LAC, Laccase.

