Figure 4.
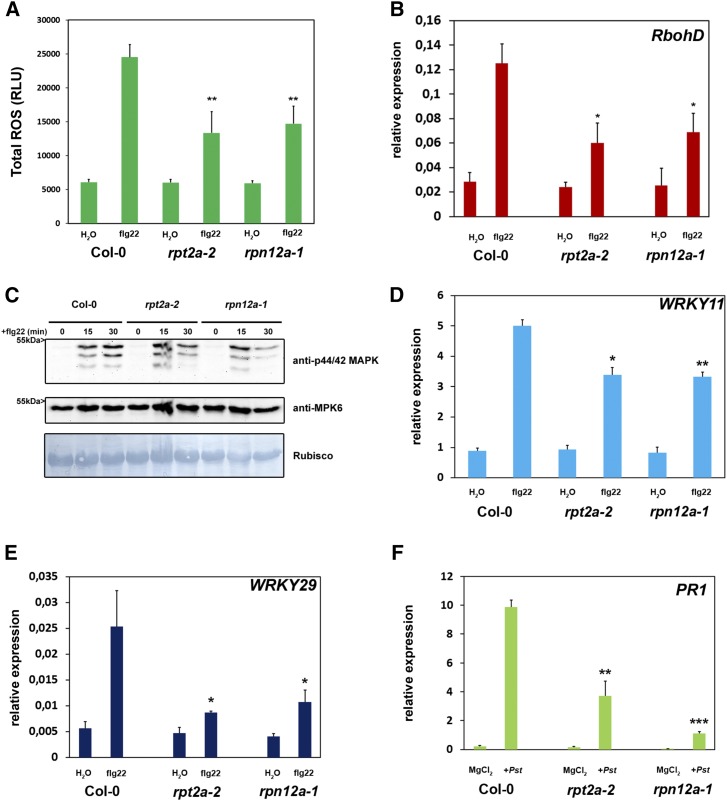
The proteasome is required for PAMP-triggered responses. A, Total production of ROS in relative light units (RLU) during treatment with 1 µm flg22 for 45 min. Each bar represents the mean of four biological replicates ± sd. Statistical significance compared with Col-0 plants treated with flg22 is indicated by asterisks (Student’s t test; **, P < 0.01). ROS production was evaluated in at least two independent experiments with similar results. B, Quantitative real-time PCR (RT-PCR) of ROS (RboHD) after flg22 treatment is reduced in proteasome mutants. Plants were treated with 1 µm flg22 or water (control). UBC9 (for ubiquitin carrier protein) was used as a reference gene. Similar results were obtained in three independent experiments. Each bar represents the mean of three biological replicates ± sd. Changes in fold expression are significant for all genes in comparison with the wild type (+flg22) according to Student’s t test (*, P < 0.05) C, MAPK signaling is impaired in proteasome mutant lines. Twelve-day-old seedlings were treated with 1 µm flg22, and samples were collected 0 to 30 min after treatment as indicated. Activated MAPKs were detected by immunoblotting using anti-p44/42 MAPK antibody. Proteins also were detected with anti-AtMPK6 antibody, and Amido Black staining shows equal loading. Experiments were conducted twice with similar results. D and E, PAMP-dependent induction of PTI marker genes is impaired in Arabidopsis proteasome mutant plants. Quantitative RT-PCR is shown for immune response marker genes (WRKY11 and WRKY29) 60 min after flg22 treatment. Plants were treated with 1 µm flg22 or water (control). UBC9 was used as a reference gene. Similar results were obtained in three independent experiments. Each bar represents the mean of three biological replicates ± sd. Changes in fold expression are significant for all genes in comparison with the wild type (+flg22) according to Student’s t test (**, P < 0.01 and *, P < 0.05). F, Relative PR1 expression is decreased in proteasome mutant lines in response to Pst infection. Plants were infiltrated with Pst, and gene expression was analyzed 24 h post inoculation. Each bar represents the mean of three biological replicates ± sd. Changes in gene expression are significant for all genes in comparison with the wild type (+Pst infection) according to Student’s t test (**, P < 0.01 and ***, P < 0.001). All experiments analyzing PTI responses were performed two times with similar results.

