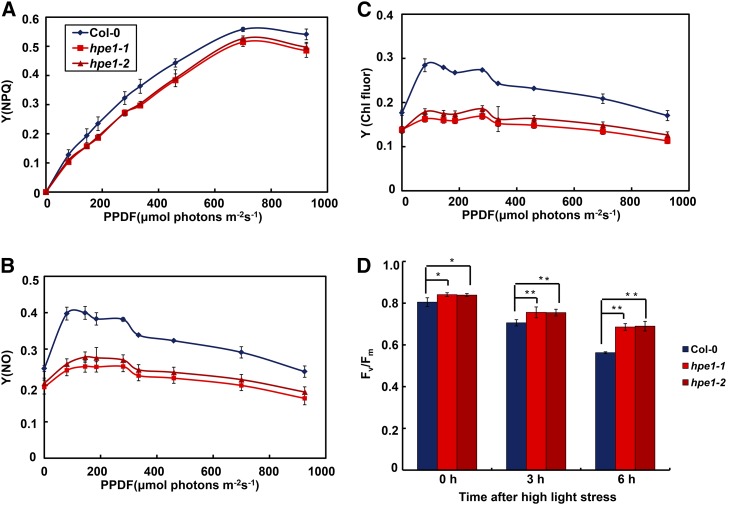
Figure 6.
Loss of the light energy of photosynthesis in the hpe1 mutants. A to C, Loss of light energy in the hpe1 mutants. Light-response curves of regulatable nonphotochemical quenching yield [Y(NPQ)] (A), nonregulatable nonphotochemical quenching yield [Y(NO)] (B), and chlorophyll fluorescence yield [Y(Chl fluor)] (C). PPDF, Photosynthetic photon flux density. Each data point represents at least 20 independent plants. D, Analysis of tolerance to high-light stress of the hpe1 mutants. Plants were exposed to high light at 1,200 μmol photons m–2 s–1 at 0, 3, and 6 h. The fraction of active PSII (Fv/Fm) was measured after dark incubation for 30 min. Data represent means ± se (n = 20). Significant differences were identified at 5% (*) and 1% (**) probability levels using Student’s t test. Differences between the hpe1 mutants and wild-type plants were more significant after high-light treatment.

