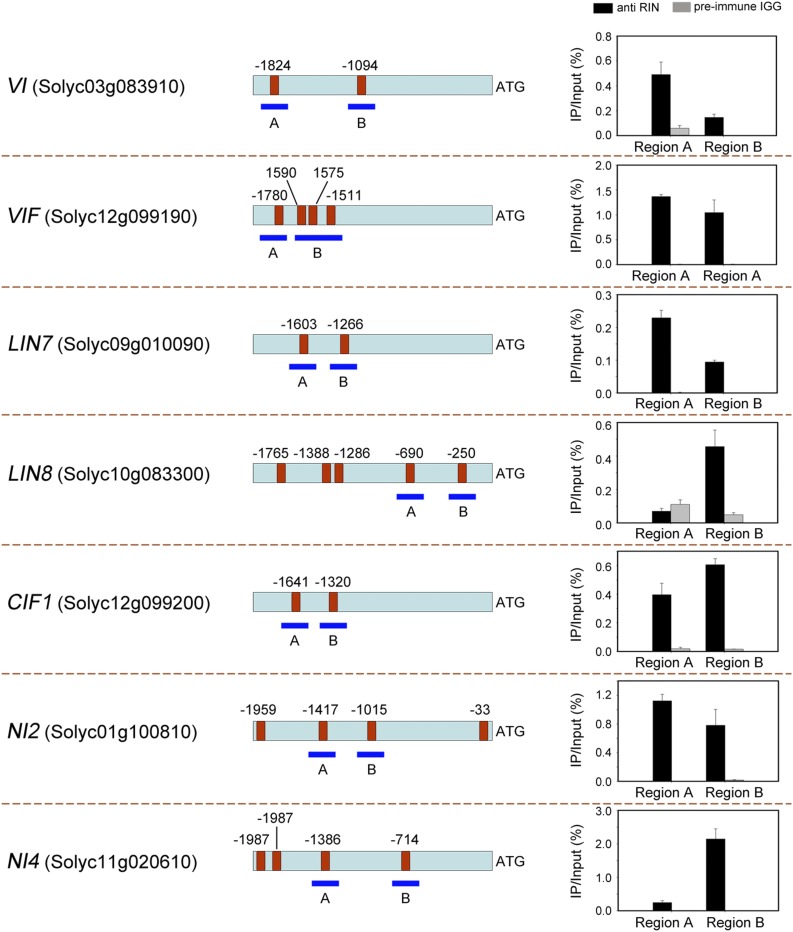
Figure 2.
Chromatin immunoprecipitation reveals direct binding of RIN to the promoters of genes involved in Suc metabolism. The promoter regions of the target genes are indicated. Red boxes represent CArG-box elements, and numbers above the box indicate the position of these motifs relative to the translational start site. The blue fragments with uppercase letters represent the regions used for ChIP-qPCR. Values are the percentage of DNA fragments that were coimmunoprecipitated with specific anti-RIN antibodies or nonspecific antibodies (preimmune rabbit IgG) relative to the input DNA. Error bars represent the sd of three independent experiments. VI, Vacuolar invertase; VIF, vacuolar invertase inhibitor; LIN, cell wall invertase; CIF, cell wall invertase inhibitor; NI, cytoplasmic invertase.

