Figure 8.
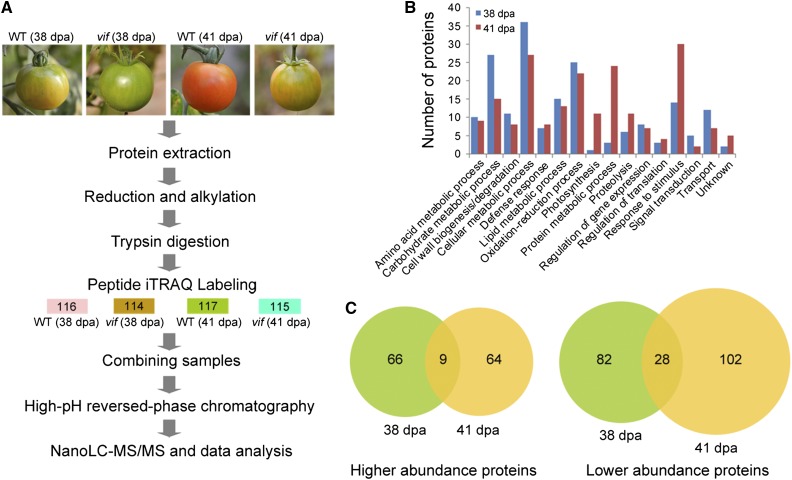
Identification of differentially expressed proteins in SlVIF silenced tomato fruits by iTRAQ-based quantitative proteomic analysis. A, Schematic diagram of the workflow used in this study. Three sets of biological replicate samples from wild-type (WT) and SlVIF-silenced fruit (vif) at 38 DPA and 41 DPA were analyzed by iTRAQ, using the NanoLC-MS/MS workflow for examining proteome changes. B, GO categories of differentially expressed proteins at 38 DPA or 41 DPA. C, Venn diagram of differentially expressed proteins identified at 38 DPA and 41 DPA. The numbers of differentially abundant proteins at each ripening stage are shown.

