Figure 2.
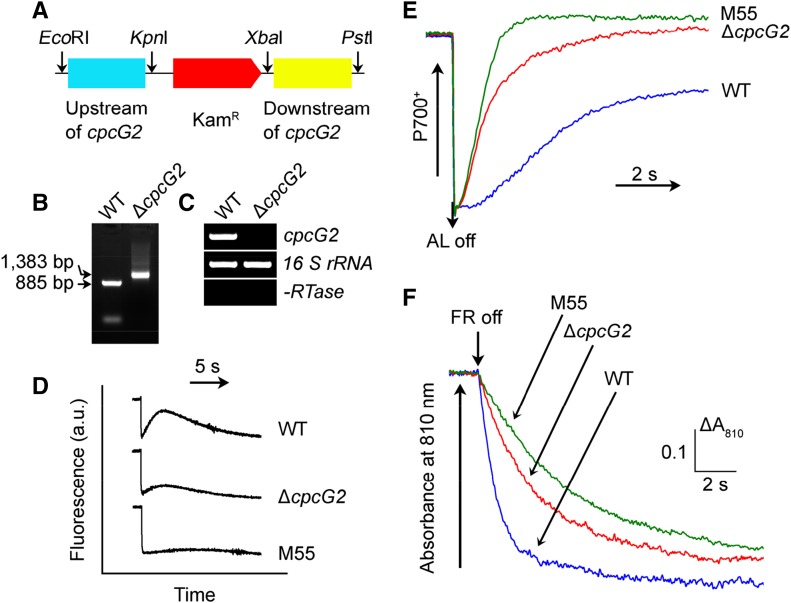
Deletion of cpcG2 and its effect on NDH-CET. A, Construction of the plasmid used to generate the cpcG2 deletion mutant (∆cpcG2). B, PCR segregation analysis of the ∆cpcG2 mutant using the cpcG2-G and cpcG2-H primer sequences (Supplemental Table S1). C, Transcript levels of cpcG2 in the wild-type (WT) and ∆cpcG2 strains. The transcript level of 16 S rRNA in each sample is shown as a control. The absence of DNA contamination was confirmed by PCR without reverse transcriptase reaction. D, Monitoring of NDH-CET activity by Chl fluorescence. For details, see the legend to Figure 1B. a.u., Arbitrary units. E, Redox kinetics of P700 after the termination of AL illumination (800 µmol photons m−2 s−1 for 30 s) under a background of FR. The cells were illuminated by AL supplemented with FR, and then AL was turned off. P700+ was reduced transiently by electrons from the plastoquinone pool and then reoxidized by background FR. The P700+ levels were standardized by their maximum levels attained by exposure to FR. F, Kinetics of the P700+ rereduction in darkness after turning off FR with a maximum at 720 nm. Wild-type, ∆cpcG2, and M55 cells were suspended in BG-11 medium containing 10 µm DCMU at the Chl a concentration of 20 µg mL−1 before measurement. Curves are normalized to the maximal signal.

