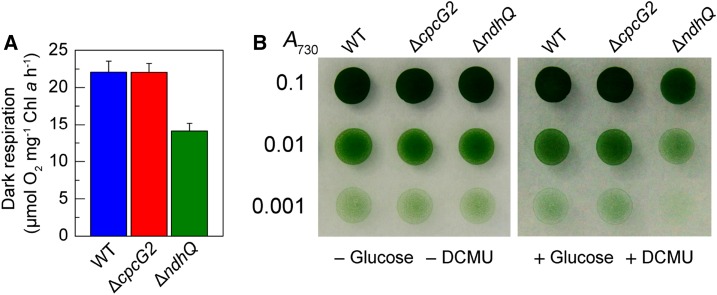
Figure 8.
Respiration of wild-type (WT) and mutant cells. A, Rate of oxygen uptake in the dark at 30°C of wild-type, ∆cpcG2, and ∆ndhQ cells grown under 2% (v/v) CO2. The Chl a concentration was adjusted to 10 µg mL−1 before measurement. Error bars indicate se (n = 5). B, Growth of wild-type, ∆cpcG2, and ∆ndhQ cells on agar plates in the absence (left) and presence (right) of Glc (5 mm) and DCMU (10 µm). Three microliters of cell suspensions with densities corresponding to A730 values of 0.1 (top rows), 0.01 (middle rows), and 0.001 (bottom rows) was spotted on agar plates and incubated under 2% (v/v) CO2 in air for 6 d at 40 µmol photons m−2 s−1.

