Figure 6.
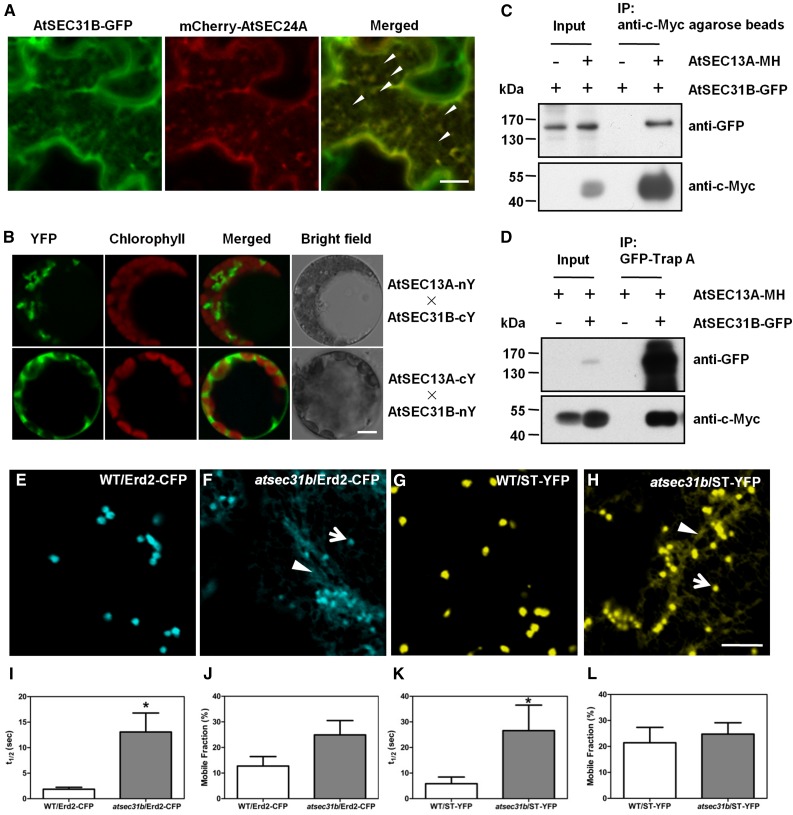
ERES-localized AtSEC31B is colocalized and interacts with AtSEC13A, and its disruption causes traffic defects of two Golgi markers. A, AtSEC31B-GFP well overlapped with the ER exit site marker, mCherry-AtSEC24A, in tobacco leaf cells. Bar = 10 μm. B, BiFC assay showing the interaction between AtSEC31B and AtSEC13A directly in Arabidopsis living protoplasts. cY, C-terminal fragment of YFP; nY, N-terminal fragment of YFP. Bar = 10 μm. C and D, Co-IP between AtSEC31B and AtSEC13A in vivo by stably transgenic plants driven by native promoters. IP, Immunoprecipitate. E to L, Confocal images and FRAP analysis of the subcellular pattern for Erd2-CFP (E and F) and ST-YFP (G and H) in epidermal cells of 3-week-old rosette leaves. The CFP and YFP signals were partially retained in the ER, as observed in the confocal laser scanning microscopy images, which were reflected by the larger fluorescence recovery half-time (t1/2) in atsec31b plants than in wild-type (WT) plants (I and K), despite the mobile fraction being similar (J and L). The white arrows and arrowheads indicate Golgi stacks and the ER, respectively. Sample size in each test was more than 10 Golgi spots. Each data point represents a mean value ± se (n > 10). Asterisks in I to L indicate significant differences relative to the wild type (Student’s t test, *, P < 0.05). Bars = 5 μm.

