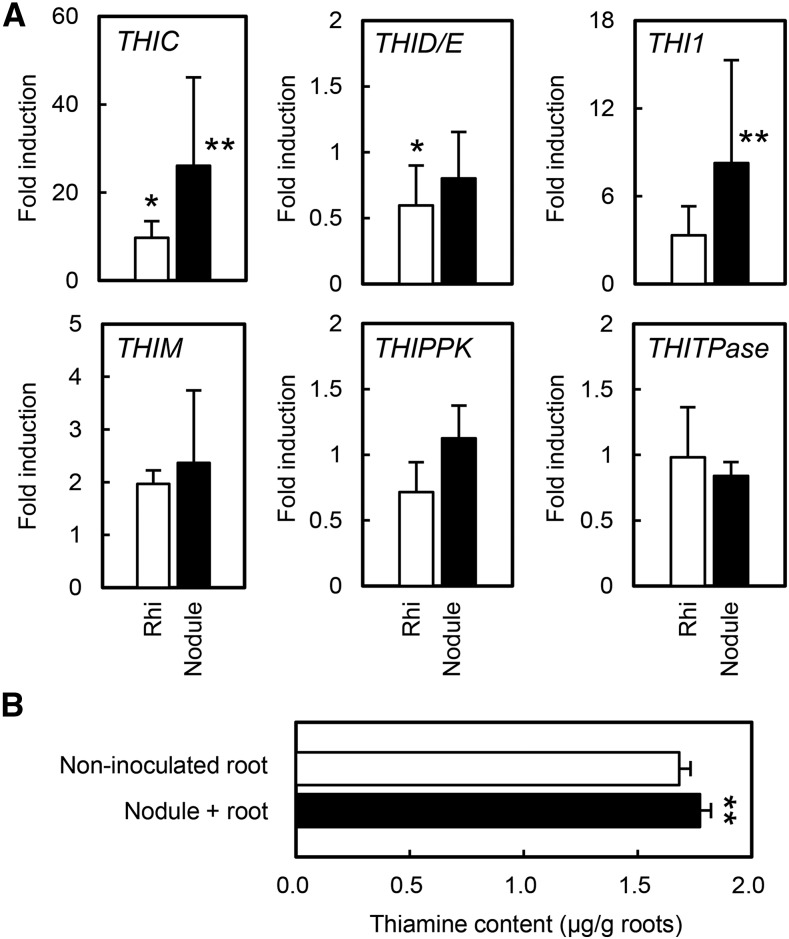
Figure 1.
Expression of thiamine biosynthesis genes and thiamine content during RN symbiosis. A, Expression levels in whole roots (Rhi) and nodules (Nodule) were measured 2 weeks after inoculation with M. loti. Expression was normalized to that in noninoculated roots. Error bars indicate sd (n = 3). Asterisks indicate significant differences from noninoculated roots (Student’s t test: *, P < 0.05 and **, P < 0.01). B, Thiamine content in roots was measured 3 weeks after inoculation with (Nodule + root) or without (Non-inoculated root) M. loti. Error bars indicate sd (n = 3 or 4). Asterisks indicate significant differences from noninoculated roots (Student’s t test: **, P < 0.01).

